In which ecosystem species diversity is low ?
Grassland
Deciduous forest
Tundra
Tropical rain forest
Step-by-Step Solution:
1. Understanding Ecosystems: Begin by recognizing what an ecosystem is. An ecosystem consists of living organisms (plants, animals, and microorganisms) interacting with their physical environment (soil, water, climate).
2. Identifying Ecosystem Types: The question provides four types of ecosystems to consider: grassland, deciduous forest, tundra, and tropical rainforest.
3. Evaluating Species Diversity: Species diversity refers to the variety of different species present in an ecosystem. High species diversity indicates a wide range of species, while low species diversity indicates fewer species.
4. Analyzing Each Ecosystem:
- Grassland: Known for high biodiversity due to favorable conditions and a variety of grass species.
- Deciduous Forest: Typically has a high biodiversity index with many species of trees and animals.
- Tundra: Characterized by extreme conditions such as low temperatures, low precipitation, and short growing seasons. This leads to limited plant growth, primarily consisting of mosses and short grasses. The tundra has low species diversity, with only about 1700 species of flora and 48 land mammals.
- Tropical Rainforest: Recognized for its incredibly high biodiversity, with estimates of 3 to 50 million species.
5. Conclusion: After analyzing the ecosystems, it is clear that the tundra has the lowest species diversity due to its harsh environmental conditions that limit the types of species that can thrive there.
Final Answer:
The ecosystem in which species diversity is low is the tundra.
---
- Grassland: Known for high biodiversity due to favorable conditions and a variety of grass species.
- Deciduous Forest: Typically has a high biodiversity index with many species of trees and animals.
- Tundra: Characterized by extreme conditions such as low temperatures, low precipitation, and short growing seasons. This leads to limited plant growth, primarily consisting of mosses and short grasses. The tundra has low species diversity, with only about 1700 species of flora and 48 land mammals.
- Tropical Rainforest: Recognized for its incredibly high biodiversity, with estimates of 3 to 50 million species.
The ecosystem in which species diversity is low is the tundra.
Topper's Solved these Questions
- BOOK - VMC MODULES ENGLISHCHAPTER - ECOSYSTEMEXERCISE - ENABLE50videos
ECOSYSTEM
- BOOK - VMC MODULES ENGLISHCHAPTER - ECOSYSTEMEXERCISE - EFFICIENT49videos
ECOSYSTEM
- BOOK - VMC MODULES ENGLISHCHAPTER - BIOTECHNOLOGY AND ITS APPLICATIONS EXERCISE - IMPECCABLE51videos
BIOTECHNOLOGY AND ITS APPLICATIONS
- BOOK - VMC MODULES ENGLISHCHAPTER - EVOLUTION EXERCISE - IMPECCABLE54videos
EVOLUTION
Similar Questions
Knowledge Check
- Question 1 - Select One
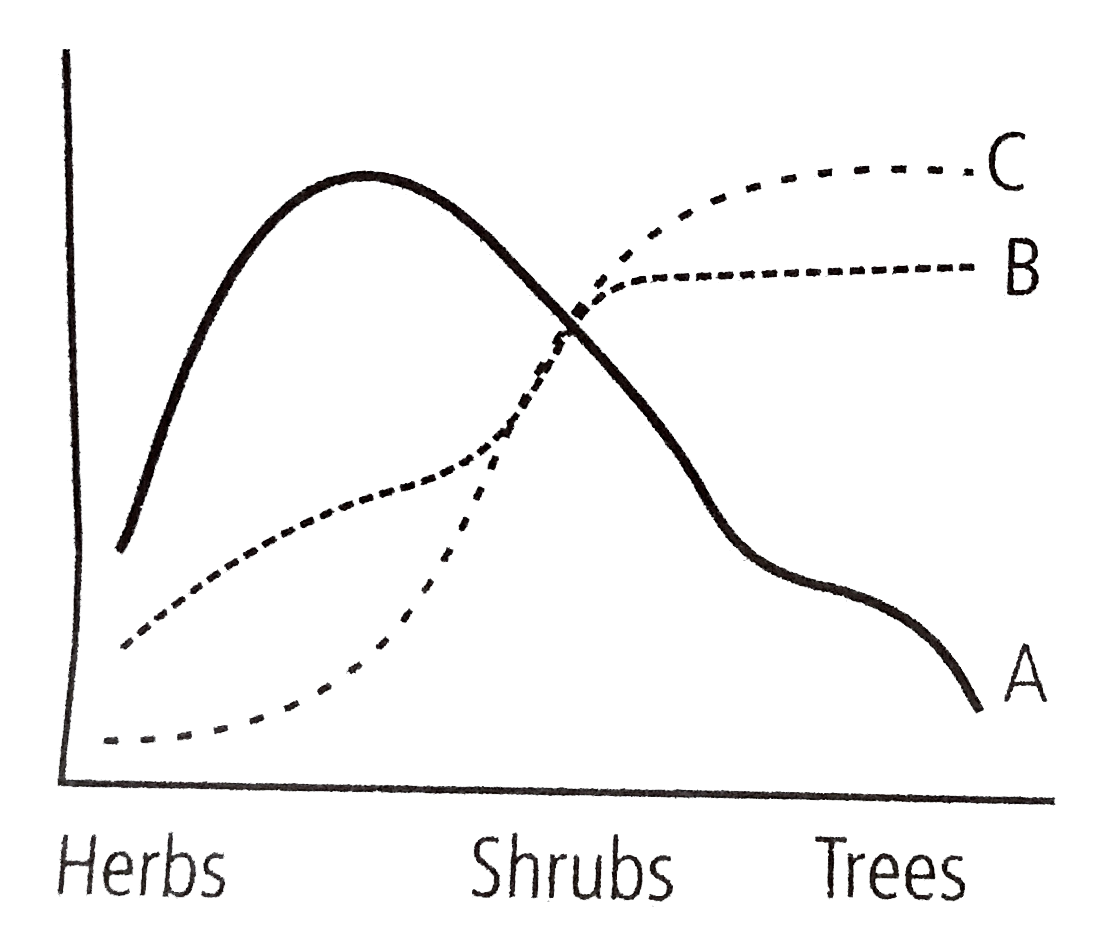
Succession in a forest ecosystem is characterised by chnages in species diversity , biomass and net primary productivity as shwon in the graph below, identify curves A,B and C.
 AA: biomass B: net primary productivity C: species diversityBA: species diversity B: net primary productivity C: biomassCA: net primary productivity B: biomass C: species diversityDA: net primary productivity B: species diversity C: biomass
Which of the following is a correct representation of the species diversity of birds in the regions mentioned?
View SolutionElaborate how invasion by an alien species reduces the species diversity of an area.
View SolutionWhich of the following is an example of alien species invading a new ecosystem resulting in biodiversity losses ?
View SolutionIndia's share in the global species diversity is about
View SolutionThe simplest measure of species diversity is
View SolutionDefine two measures of species diversity.
View SolutionThe species diversity decreases from lower to higher altitudes on a mountain. This is due to
View Solution


