Figure shows graph between I and V for two conductors A and B. Their respective resistances are in the ratio.
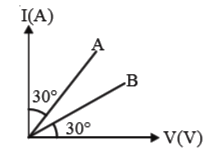
1:1
1:3
3:1
1:2
The correct Answer is:B
Step by step video & image solution for Figure shows graph between I and V for two conductors A and B. Their respective resistances are in the ratio. by Physics experts to help you in doubts & scoring excellent marks in Class 12 exams.
Topper's Solved these Questions
- BOOK - VMC MODULES ENGLISHCHAPTER - CURRENT ELECTRICITYEXERCISE - IN-CHAPTER EXERCISE-C10videos
CURRENT ELECTRICITY
- BOOK - VMC MODULES ENGLISHCHAPTER - CURRENT ELECTRICITYEXERCISE - IN-CHAPTER EXERCISE-D9videos
CURRENT ELECTRICITY
- BOOK - VMC MODULES ENGLISHCHAPTER - CURRENT ELECTRICITYEXERCISE - IN-CHAPTER EXERCISE-A10videos
CURRENT ELECTRICITY
- BOOK - VMC MODULES ENGLISHCHAPTER - CAPACITORSEXERCISE - JEE Advance ( Archive ) LEVEL 481videos
CAPACITORS
- BOOK - VMC MODULES ENGLISHCHAPTER - DC CIRCUITEXERCISE - JEE ADVANCED ARCHIVE68videos
DC CIRCUIT
Similar Questions
Fig. shows I-V graph for two conductors A and B.
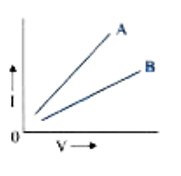
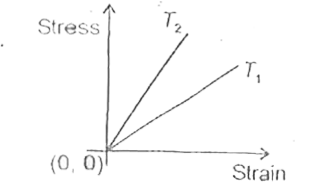
Which conductor has more resistance ? Give reason to you r answer.View SolutionFigure shows graph between stress and strain for a uniform wire at two different temperatures. Then
 View Solution
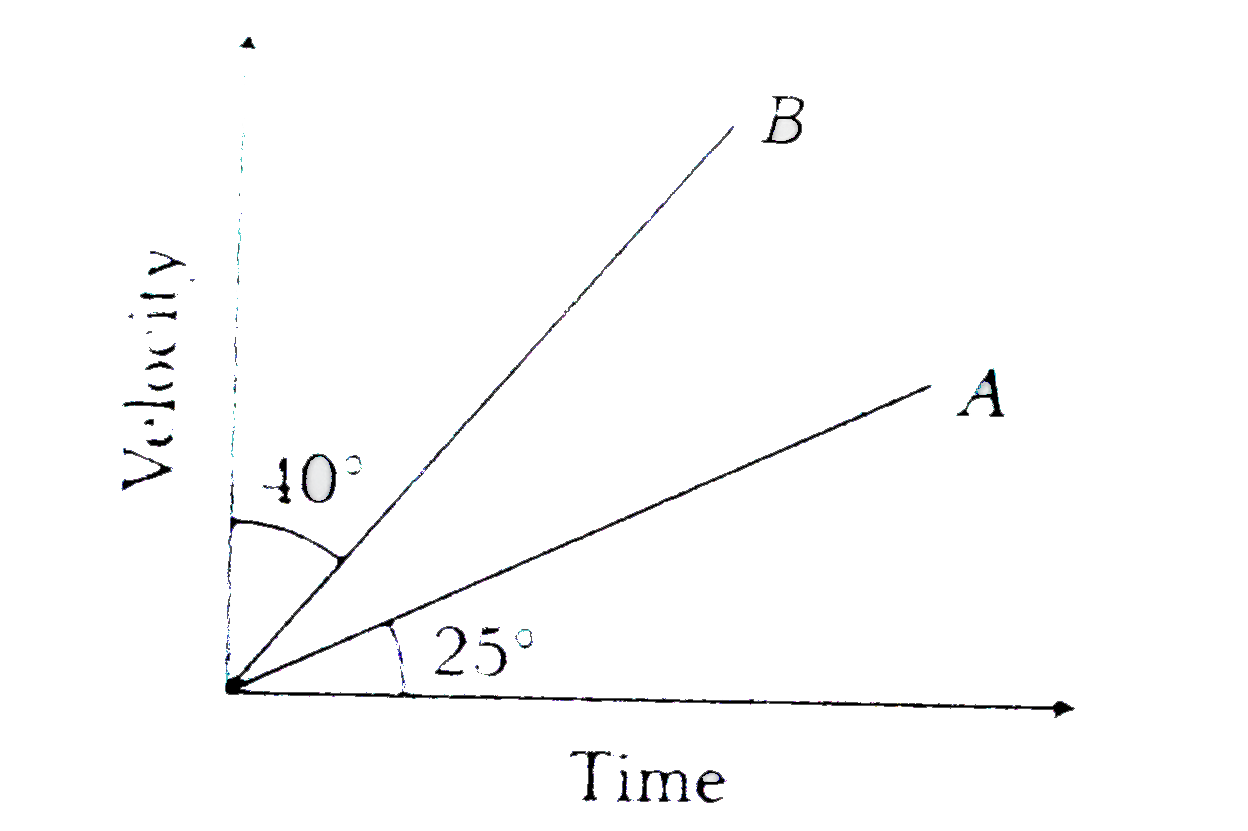
The velocity - time graph for two bodies A and B are shown in figure. Then, the acceleration of A and B are in the ratio
 View Solution
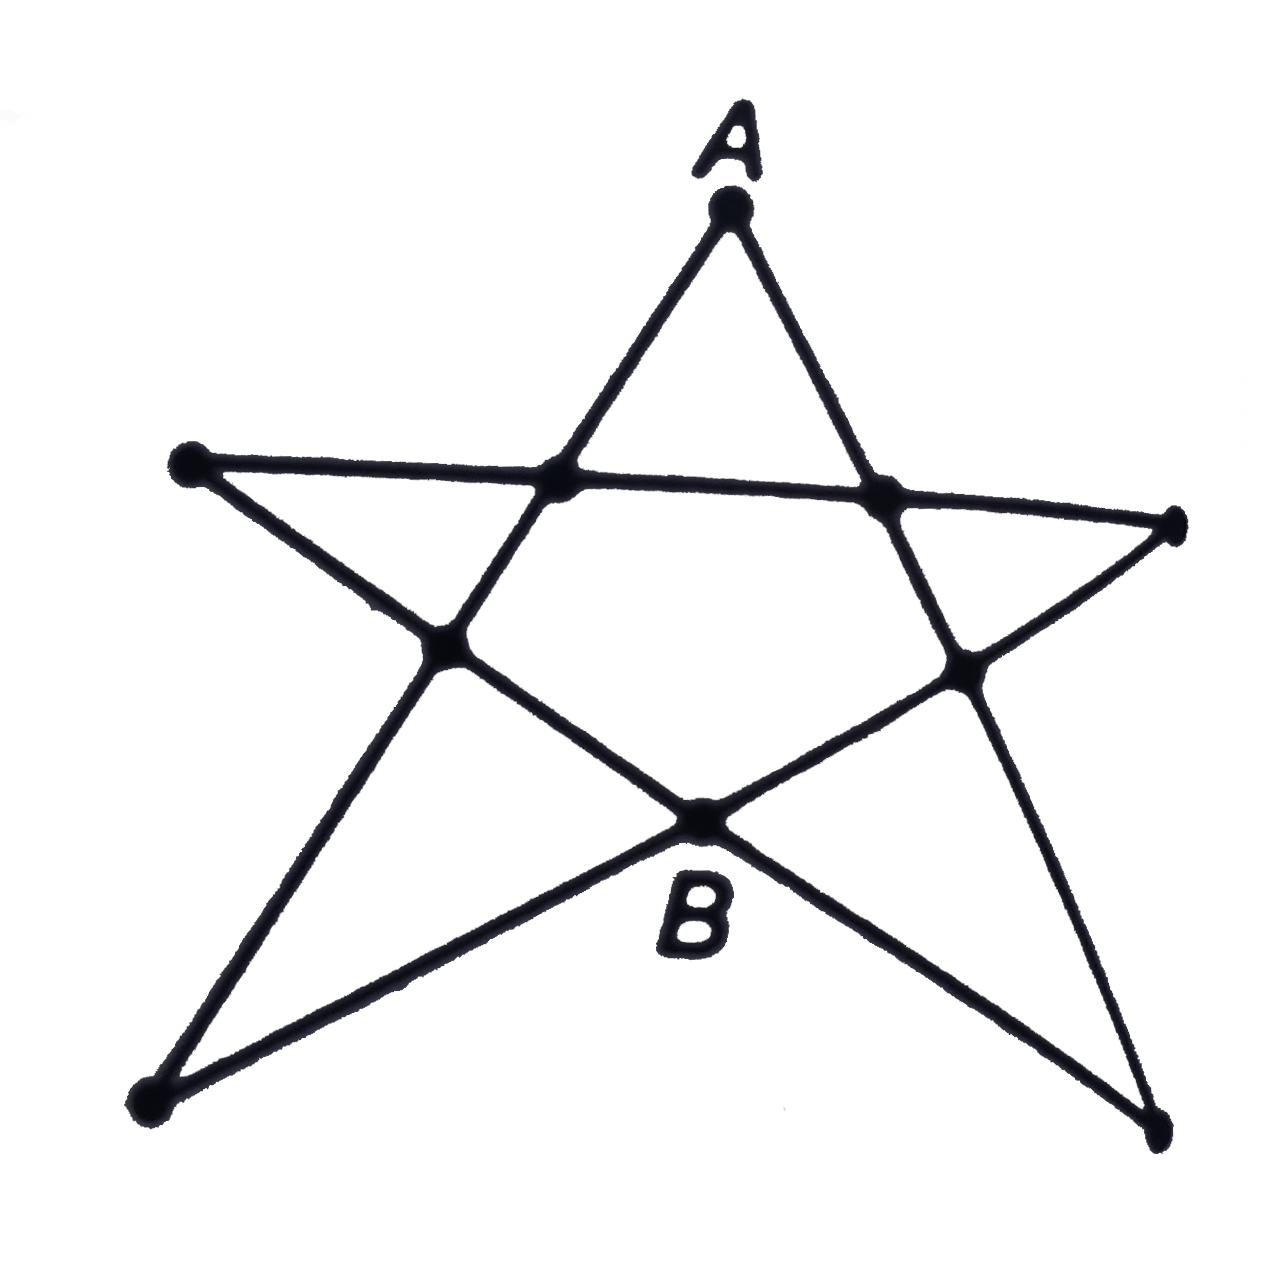
The resistance of all the wires between any two adjacent dots is R. Then, equivalent resistance between Aand B as shown in figure is
 View Solution
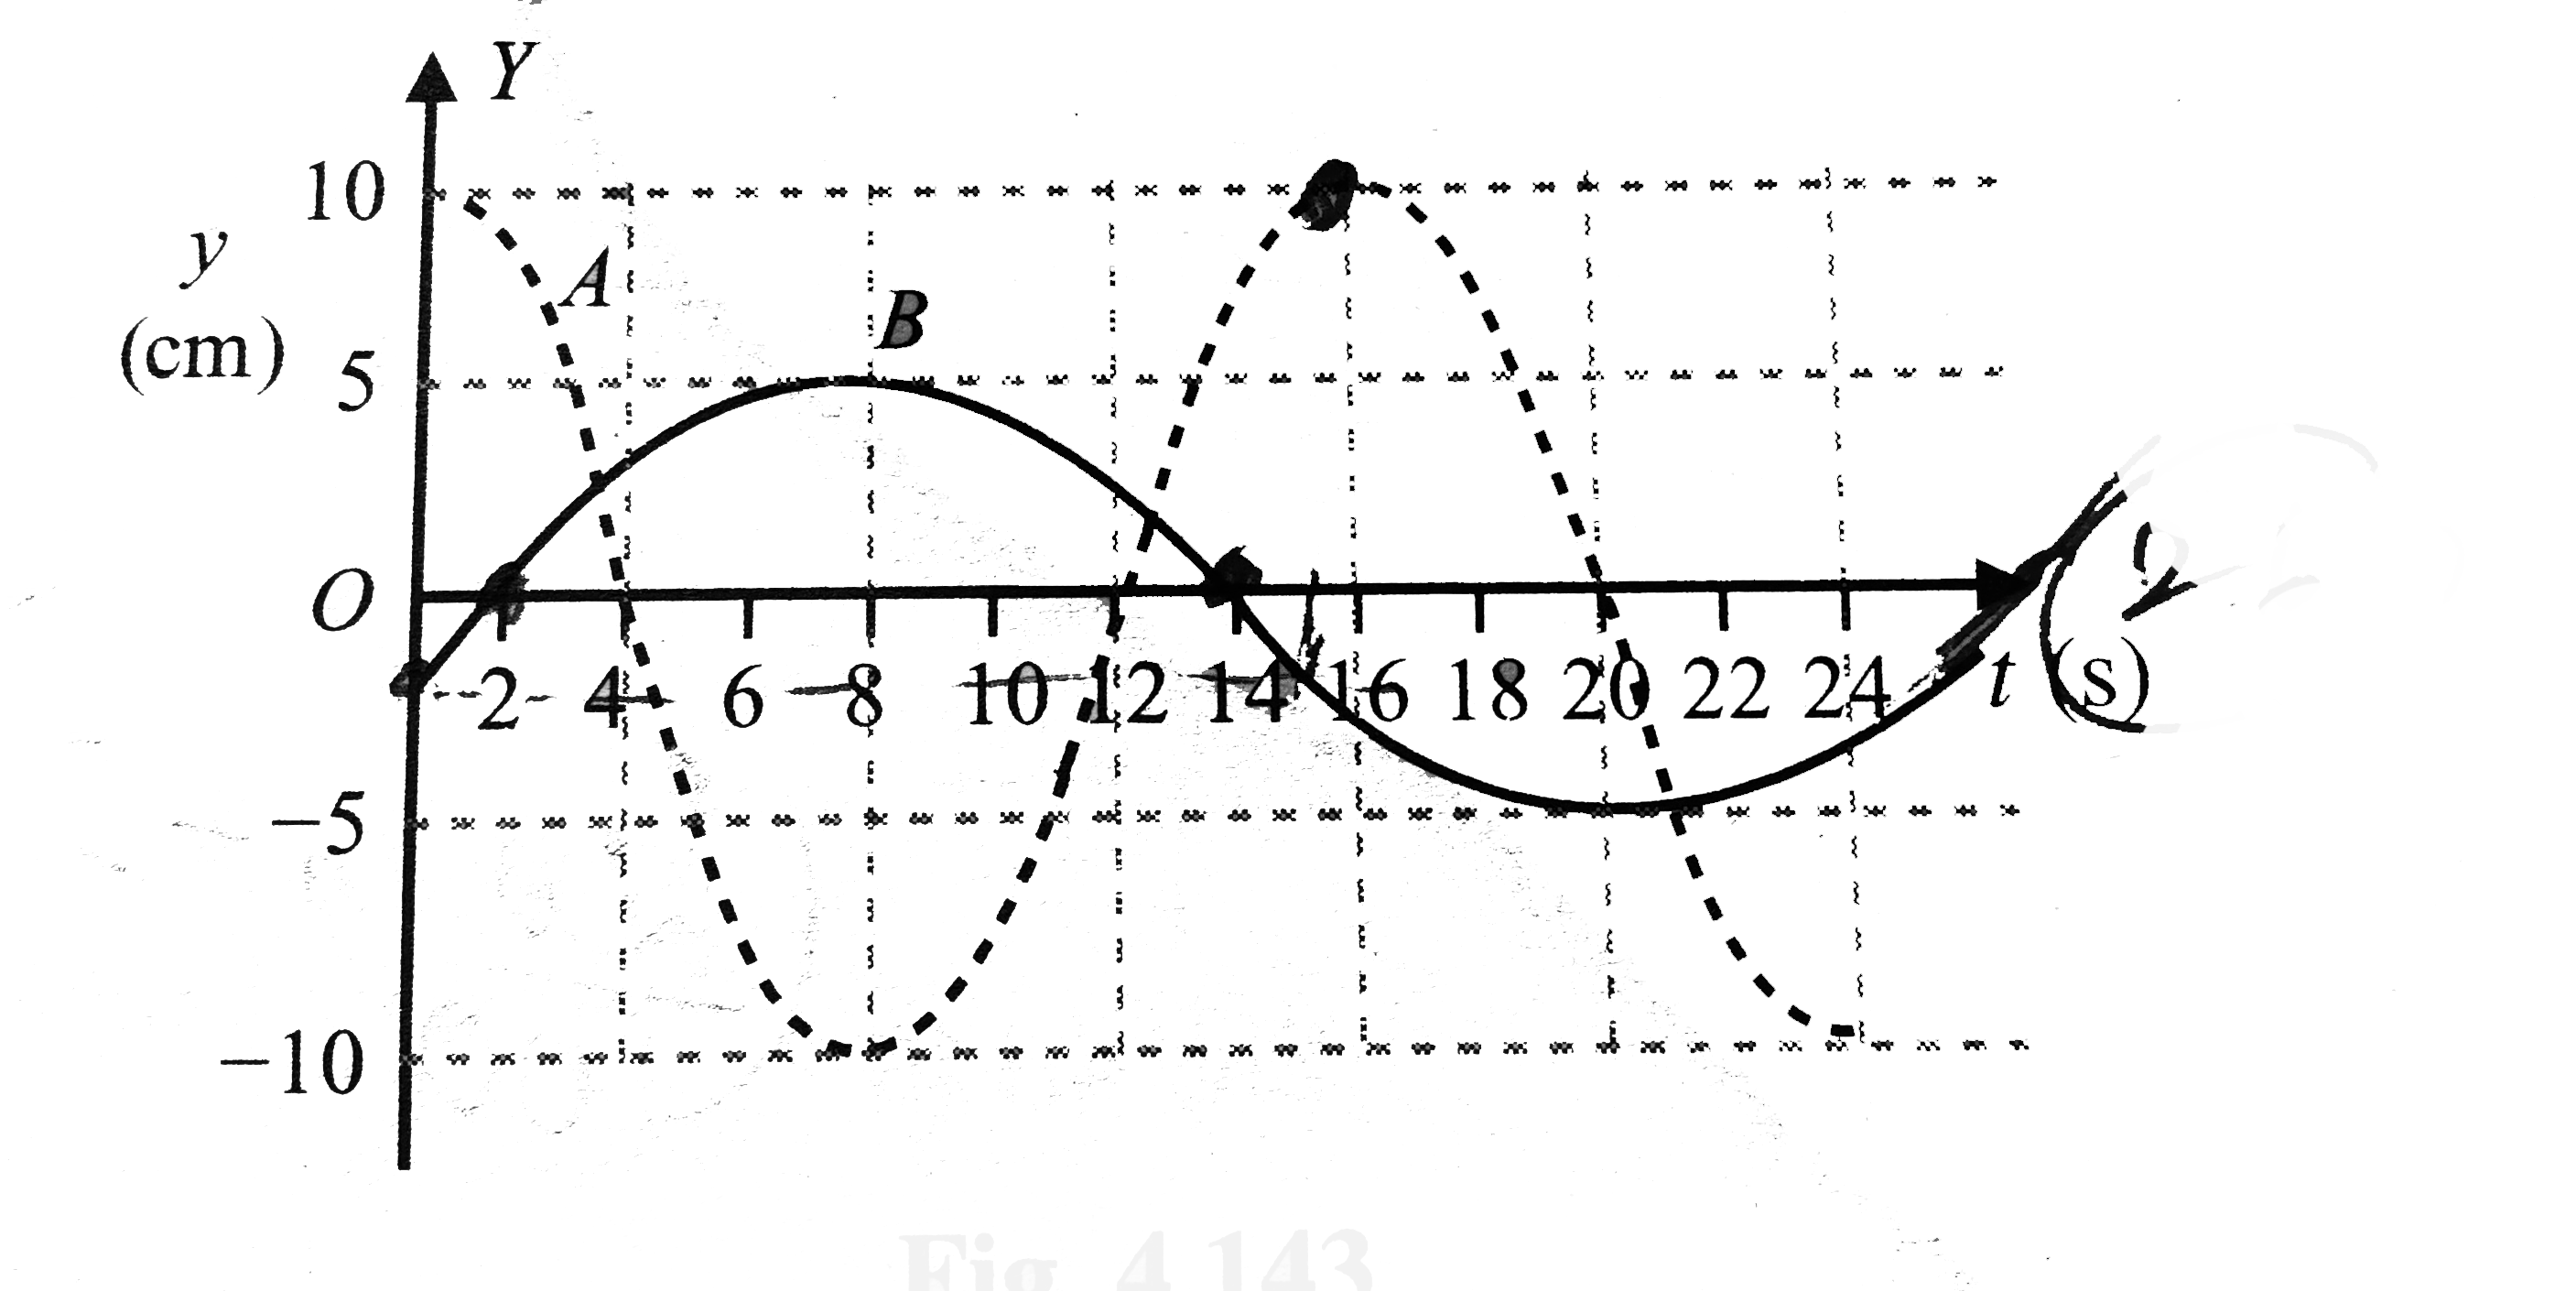
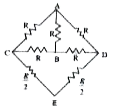
The following figure shows the displacement versus time graph for two particles A and B executing simple harmonic motions. The ratio of their maximum velocities isView SolutionThe adjacent figure shows a resistance network with value of each resistance is R. The equivalent resistance across .A and B., .A and C. and .C and B. are RAB,RACandRCB respectively then
 View Solution
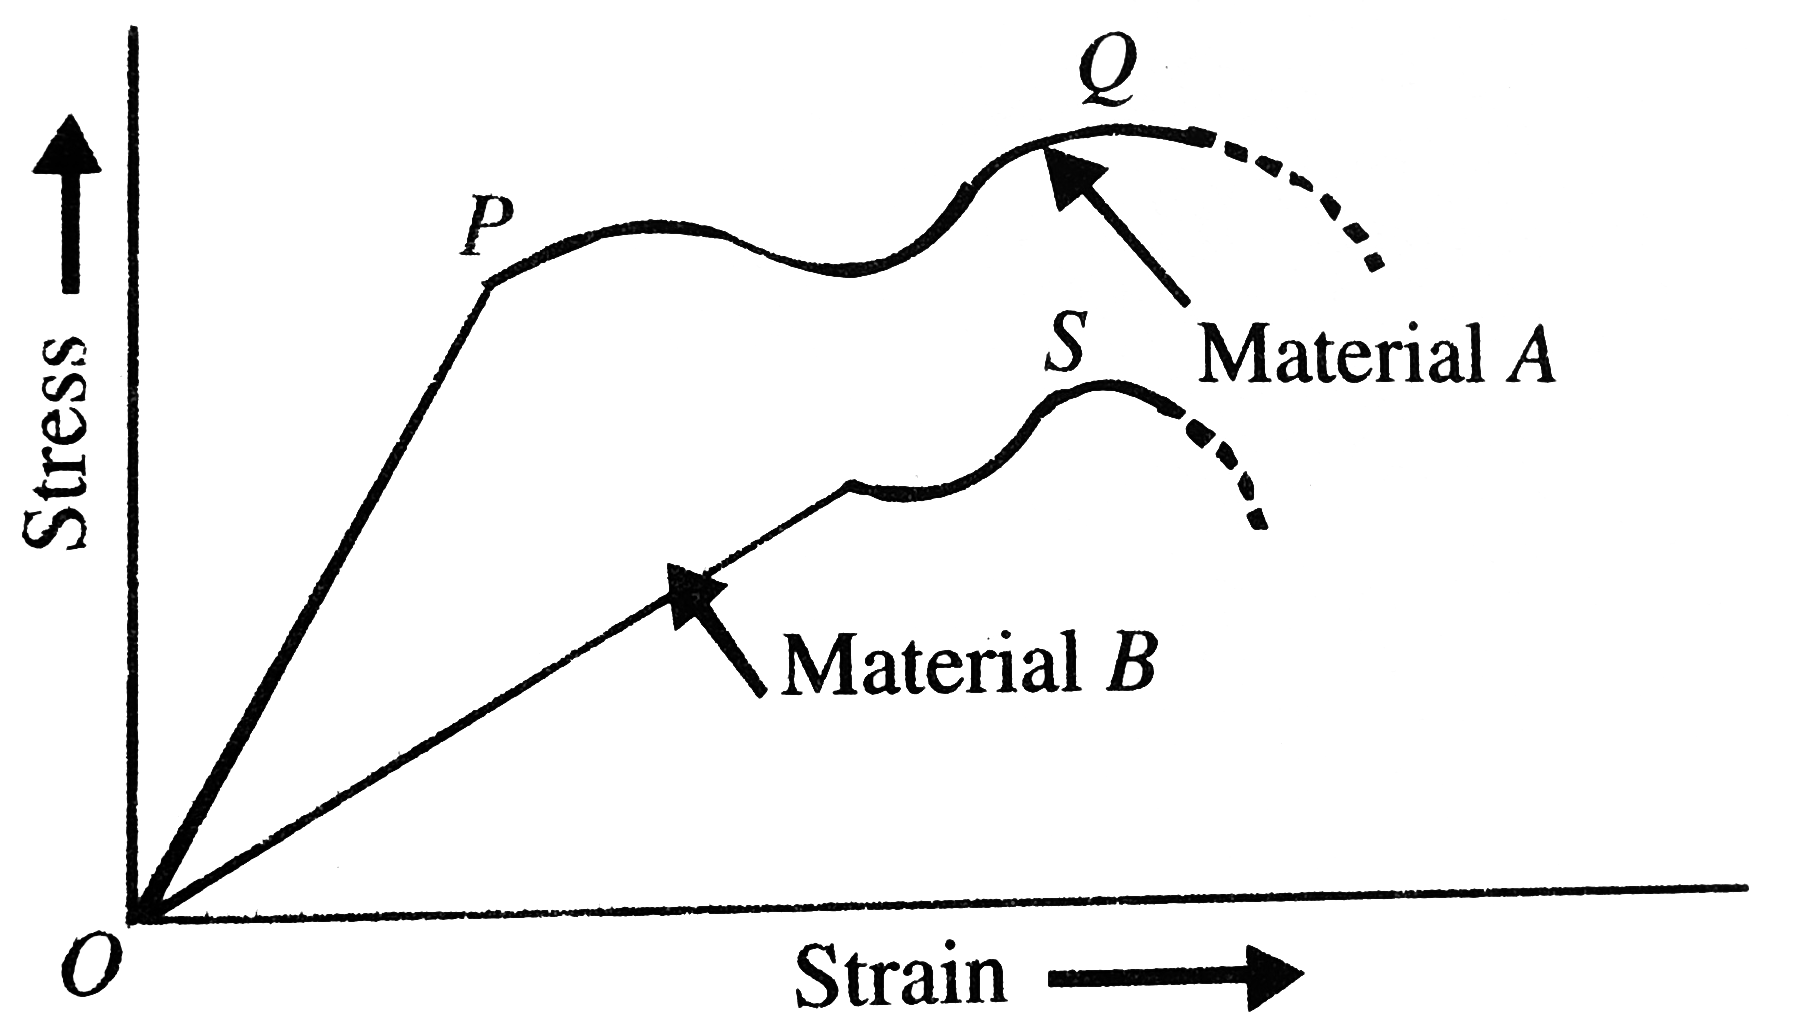
Figure shows the stress-strain graphs for materials .A and B. From the graph it follows that
 View Solution
Figure shows the stress-strain graphs for materials .A and B. From the graph it follows that
 View Solution
Let V and I respresent, respectively, the readings of the voltmeter and ammetre shows in Fig. 6.34, and let RV and RV be their equivalent resistances. Because of the resistances of the meters, the resistnce R is not simply equal to V/I.
(a) When the circuit is connected as shows in Fig. 6.34 (a), shows that R=VI−RA
Explain why the true resistance R is always less than V/I.
(b) When the connections are as shows in Fig.6.34 (b)
Show that R=VI−(V/RV)
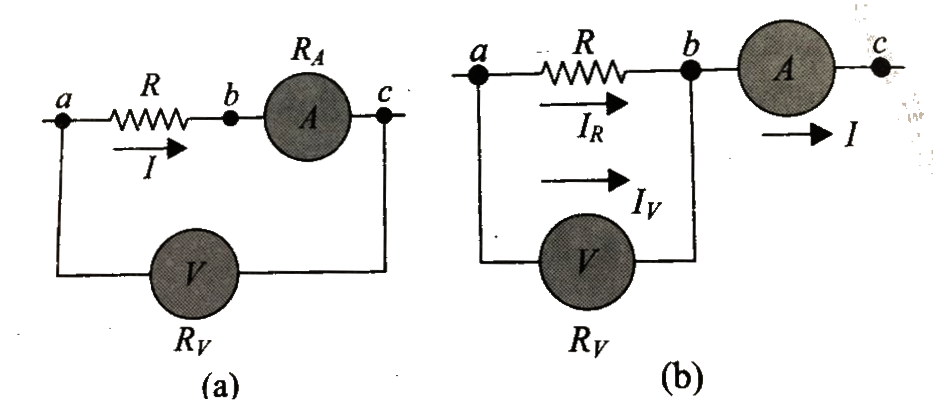
Explain why the true resistance R is always greater than V/I.
(c ) Show that the power delivered to the resistor in part
(i) is IV−I2RA and that in part (ii) is IV−(V2/RV)View SolutionFree resistors are connected as shown in adjoining figure.
The effective resistance i.e. quivalent resistance between the points A and B is :View Solution

