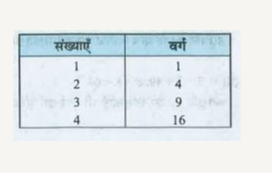
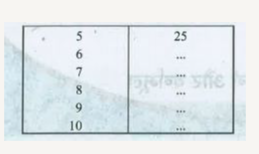
निम्न संख्याओं और उनके वर्गों के बारे में विचार कीजिए-
क्या आप इसे पूरा कर सकते हैं?


उपर्युक्त सारणी में क्या आप 1 से 100 के बीच की वर्ग संख्याओं को लिख सकते हैं? क्या 100 तक कोई प्राकृत वर्ग संख्या छूट गई है?
Step by step video & image solution for निम्न संख्याओं और उनके वर्गों के बारे में विचार कीजिए- क्या आप इसे पूरा कर सकते हैं? उपर्युक्त सारणी में क्या आप 1 से 100 के बीच की वर्ग संख्याओं को लिख सकते हैं? क्या 100 तक कोई प्राकृत वर्ग संख्या छूट गई है? by Maths experts to help you in doubts & scoring excellent marks in Class 8 exams.
Updated on:21/07/2023Topper's Solved these Questions
- वर्ग और वर्गमूलBOOK - SHIVLAAL PUBLICATIONCHAPTER - वर्ग और वर्गमूलEXERCISE - Exercise
120 Videos
- राशियों की तुलनाBOOK - SHIVLAAL PUBLICATIONCHAPTER - राशियों की तुलनाEXERCISE - Exercise
40 Videos
- संख्याओं के साथ खेलनाBOOK - SHIVLAAL PUBLICATIONCHAPTER - संख्याओं के साथ खेलनाEXERCISE - Exercise
14 Videos
Similar Questions
निम्नलिखित संख्याओ के वर्गों के इकाई के अंक क्या होंगे ?
(i)81(ii)272(iii)799(iv)3853(v)1234(vi)26387(vii)52693(viii)99880(ix)12796(x)55555
View Solutionनिम्नलिखित का अनुपात ज्ञात कीजिए :
(a) एक साइकिल की 15 km प्रतिघंटे की गति का एक स्कूटर की 30 km प्रतिघंटे की गीत से ।
(b) 5 m का 10 km से (c) 50 पैसे का Rs. 5 से
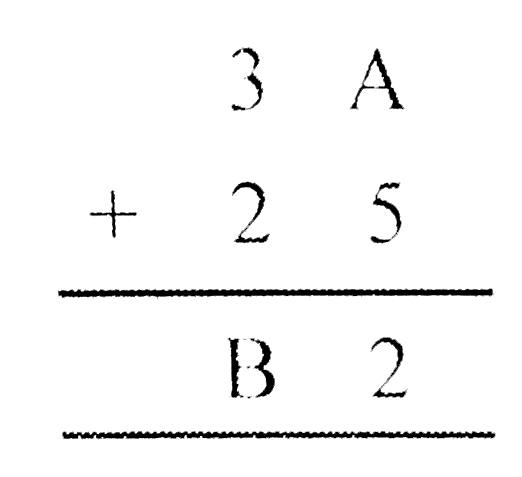
View Solutionनिम्नलिखित में से प्रत्येक में अक्षरों के मान ज्ञात कीजिए तथा संबद्ध चरणों के लिए कारण भी दीजिएः

View SolutionHow many lines of symmetry does the above figure have ?
View SolutionWhich of the following are correct chain isomers of butane ? (i)
View SolutionDetermine the point of symmetry of a regular hexagon.
View SolutionDtermine the images of the following figure about the given line :
View SolutionMatch the following Column A to Column B

View SolutionMatch the following Column A to Column B

View SolutionMatch the following Column A to Column B

View SolutionFind the area of the figure given below.

View SolutionThe area of the shaded part in the figure given below is ______.

View SolutionThe inequation represented by the graph given below is :
View SolutionThe inequation that best describes the graph given below is _________
View SolutionThe inequation that best describes the following graph is _________
View SolutionWhich inequations represent the shaded region in the given figure
View Solution
