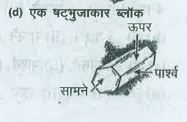
दिए गए एक ष्टभुजाकार ब्लॉक के, सामने से दृश्य, पार्श्व दृश्य और ऊपर से दृश्य खींचिए।

Step by step video & image solution for दिए गए एक ष्टभुजाकार ब्लॉक के, सामने से दृश्य, पार्श्व दृश्य और ऊपर से दृश्य खींचिए। by Maths experts to help you in doubts & scoring excellent marks in Class 8 exams.
Updated on:21/07/2023Topper's Solved these Questions
Similar Questions
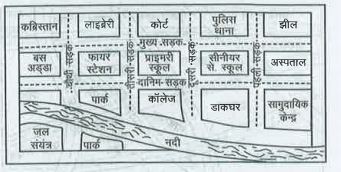
एक नगर के संलग्न मानचित्र को देखिए।
 कॉलेज से झील तक के लिए एक छोटा सड़क का मार्ग गहरे गुलाबी रंग में खींचेए।
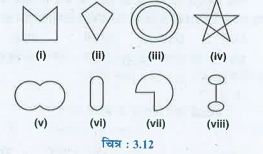
View Solutionयहाँ पर कुछ आकृतिया दी गयी है । प्रत्येक का वर्गीकरण निन्मलिखित आधार पर कीजिये - साधारण वक्र

View Solutionपाइथागोरस त्रिकों के बारे में कुछ और हम पाइथागोरस त्रिकों (Pythagorean triplets) को एक प्रकार 2m,m2−1,m2+1 से लिखना देख चुके हैं।
एक पाइथागोरियन त्रिक a, b, c का अर्थ a2+b2=c2 है। यदि हम दो प्राकृत संख्याओं m और n का प्रयोग करें (m>n) तथा a=m2−n2,b=2nm और c=m2+n2 लें तो हम देख सकते हैं कि c2=a2+b2 है। इस प्रकार, m>n के साथ, हम m और n के विभिन्न मानो के लिए प्राकृत संख्याएँ a, b, c ऐसी बना सकते हैं कि वे पाइथागोरियन त्रिक बनाएँ।
उदाहरणार्थ, m = 2, n = 1 लीजिए।
तब a=m2−n2=3,b=2mn=4,c=m2+n2=5, एक पाइथागोरिन त्रिक है। (इसकी जाँच कीजिए। )
,m=3, n=2 के लिए हम प्राप्त करते हैं।
a = 5, b = 12, c = 13 जो पुनः एक पाइथागोरियन त्रिक है।
m और n के कुछ मान लीजिए तथा इस प्रकार के कुछ और मान लीजिए तथा इस प्रकार के और अधिक त्रिक जनित कीजिए।
View SolutionHow many lines of symmetry does the above figure have ?
View SolutionWhich of the following are correct chain isomers of butane ? (i)
View SolutionDetermine the point of symmetry of a regular hexagon.
View SolutionDtermine the images of the following figure about the given line :
View SolutionMatch the following Column A to Column B

View SolutionMatch the following Column A to Column B

View SolutionMatch the following Column A to Column B

View SolutionFind the area of the figure given below.

View SolutionThe area of the shaded part in the figure given below is ______.

View SolutionThe inequation represented by the graph given below is :
View SolutionThe inequation that best describes the graph given below is _________
View SolutionThe inequation that best describes the following graph is _________
View SolutionWhich inequations represent the shaded region in the given figure
View Solution
