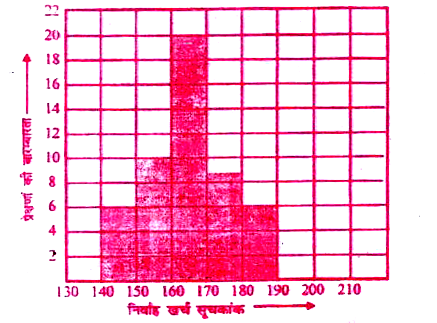
सन 1970-71 में किसी नगर के निर्वाह खर्च सूचकांक पर किए गये सर्वेक्षण में निम्नलिखित साप्ताहिक प्रेक्षण लिये चिन्हें बगल के आलेख में दिखाया गया है आलेख को देखकर दिये गये वर्ग अंतरालों की बारम्बारता लिखे।

(i) 180-190
(ii) 40-50
(iii) महत्तम बारम्बारता वाले वर्ग अन्तराल
The correct Answer is:(i) 6
(ii)10
(iii) 160-170
Step by step video & image solution for सन 1970-71 में किसी नगर के निर्वाह खर्च सूचकांक पर किए गये सर्वेक्षण में निम्नलिखित साप्ताहिक प्रेक्षण लिये चिन्हें बगल के आलेख में दिखाया गया है आलेख को देखकर दिये गये वर्ग अंतरालों की बारम्बारता लिखे। (i) 180-190 (ii) 40-50 (iii) महत्तम बारम्बारता वाले वर्ग अन्तराल by Maths experts to help you in doubts & scoring excellent marks in Class 9 exams.
Updated on:21/07/2023Topper's Solved these Questions
Similar Questions
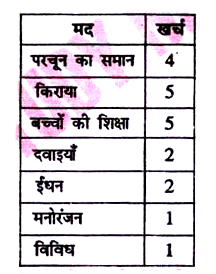
एक परिवार ने जिसकी मासिक आय 20000 रू. है विभिन्न पदों के अन्तर्गत हर महीने में होने वाले खर्च की योजना बनाई थी।

ऊपर दिए गए आँकड़ों का एक दंड आलेख खीचें।
View Solutionयदि 7 मजदूरों की दैनिक मजदूरी (रूपयों में) 35,40,45,35,40,35, 50 हो तो बहुलक मजदूरी ज्ञात करें।
View SolutionWhich of the following are correct chain isomers of butane ? (i)
View SolutionDetermine the point of symmetry of a regular hexagon.
View SolutionMatch the following Column A to Column B

View SolutionMatch the following Column A to Column B

View SolutionMatch the following Column A to Column B

View SolutionThe inequation represented by the graph given below is :
View SolutionThe inequation that best describes the graph given below is _________
View SolutionThe inequation that best describes the following graph is _________
View SolutionIn the given figure, PQRS is a parallelogram. A and B are the mid-point of ¯¯¯¯¯¯PQ and ¯¯¯¯¯SR respectively. If PS=BR, then the quadrilateral ADBC is a…………………… ,
ltimg src="https://d10lpgp6xz60nq.cloudfront.net/physics_images/PS_MATH_IX_C12_E05_020_Q01.png" width="80%"gt
View SolutionMatch the followings (column I with column II)
ltimg src="https://d10lpgp6xz60nq.cloudfront.net/physics_images/NCERT_BIO_XI_C03_E01_011_Q01.png" width="80%"gt
View SolutionMatch column I with column II
ltimg src="https://d10lpgp6xz60nq.cloudfront.net/physics_images/NCERT_BIO_XI_C16_E01_002_Q01.png" width="80%"gt
View SolutionMatch column I with column II:
ltimg src="https://d10lpgp6xz60nq.cloudfront.net/physics_images/NCERT_BIO_XI_C18_E01_003_Q01.png" width="80%"gt
View SolutionMatch Column I with Column II: ltimg src="https://d10lpgp6xz60nq.cloudfront.net/physics_images/NCERT_BIO_XI_C20_E01_010_Q01.png" width="80%"gt
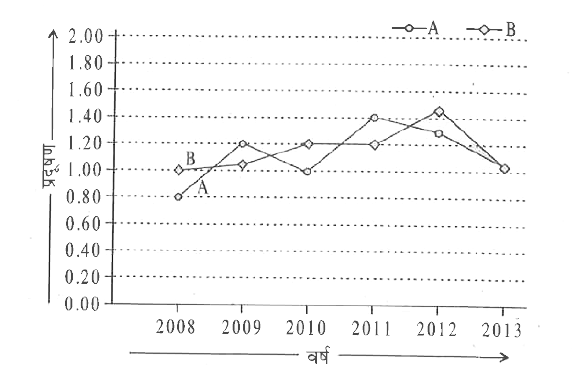
View Solutionनिचे दिये गये ग्राफ में दो प्रकार के वाहनों A व B के छ वर्षो के प्रदूषण का आंकड़ा दिया गया है ।A घरेलू वाहनों तथा B व्यावसायिक वाहनों को दर्शाता है ,तो ग्राफ का अध्ययन क्र आगे दिये गये प्रशनो के उत्तर दीजिए|
दिये गये वर्षो में से कितने वर्षो में B का प्रदूषण A के प्रदूषण से कम रहा है ?

View Solution
