Number of students appearing for class X CBSE examination increases from 91,422 in 1999–2000 to 11,6054 in 2008–09. Increase in the number of students appeared is approximately 27%.
To determine if the increase in the number of students appearing for the Class X CBSE examination is approximately 27%, we will follow these steps:
1. Identify the Initial and Final Values:
- Initial number of students (1999-2000): 91,422
- Final number of students (2008-2009): 1,16,054
2. Calculate the Increase in the Number of Students:
Increase=Final number of students−Initial number of students
Increase=1,16,054−91,422=24,632
3. Calculate the Percent Increase:
Percent Increase=(IncreaseInitial number of students)×100
Percent Increase=(24,63291,422)×100
4. Perform the Division:
24,63291,422≈0.2694
5. Convert to Percentage:
Percent Increase≈0.2694×100≈26.94%
6. Round the Result:
- The approximate percent increase is 27%.
7. Conclusion:
- Since the calculated percent increase (approximately 27%) matches the statement given in the question, we conclude that the statement is true.
- Initial number of students (1999-2000): 91,422
- Final number of students (2008-2009): 1,16,054
Increase=Final number of students−Initial number of students
Increase=1,16,054−91,422=24,632
Percent Increase=(IncreaseInitial number of students)×100
Percent Increase=(24,63291,422)×100
24,63291,422≈0.2694
Percent Increase≈0.2694×100≈26.94%
- The approximate percent increase is 27%.
- Since the calculated percent increase (approximately 27%) matches the statement given in the question, we conclude that the statement is true.
Topper's Solved these Questions
- COMPARING QUANTITIESBOOK - NCERT EXEMPLARCHAPTER - COMPARING QUANTITIESEXERCISE - Appications, Gamess and Puzzles
1 Videos
- COMPARING QUANTITIESBOOK - NCERT EXEMPLARCHAPTER - COMPARING QUANTITIESEXERCISE - Think and Discuss
2 Videos
- COMPARING QUANTITIESBOOK - NCERT EXEMPLARCHAPTER - COMPARING QUANTITIESEXERCISE - Think and Discuss
2 Videos
- ALGEBRAIC EXPRESSIONS, IDENTITIES AND FACTORISATION BOOK - NCERT EXEMPLARCHAPTER - ALGEBRAIC EXPRESSIONS, IDENTITIES AND FACTORISATION EXERCISE - EXERCISE
328 Videos
- DATA HANDLINGBOOK - NCERT EXEMPLARCHAPTER - DATA HANDLINGEXERCISE - EXERCISE
73 Videos
Similar Questions
In 2007 – 08, the number of students appeared for Class X examination was 1,05,332 and in 2008–09, the number was 1,16,054. If 88,151 students pass the examination in 2007–08 and 103804 students in 2008–09. What is the increase or decrease in pass % in Class X result?
View SolutionThe number of students appearing for the Aptitude Test from Town D is approximately what percentage of the number of students appearing for the Aptitude Test from Town C ? (a) 243 (b) 413 (c) 134 (d) 341 (e) 143
View Solution
Knowledge Check
Study the following frequency polygon and answer the questions.
Given a line graph showing the number of students passed in Higher Secondary Examination in a school over the years 2008 to 2013.
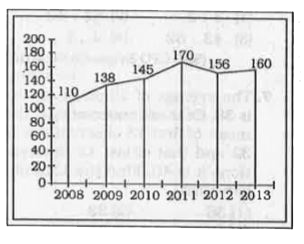
The increase in percentage of passed students from 2008 to 2011 approximately isAa)55%Bb)50.5%Cc)54.5%Dd)53.05%In 1998, ratio of the numbers of students taking examinations in x and z states are respectively 3:5:6. Next year, the numbers of students are increased by 20%, 10% and 20% respectively. If ratio of the numbers of students in states x and z is 1 : 2, then find the number of students who sit to take examination in 1998.
A7200B6000C7500DData inadequateStudy the following frequency polygon and answer the questions.
Given a line graph showing the number of students passed in Higher Secondary Examination in a school over the years 2008 to 2013.
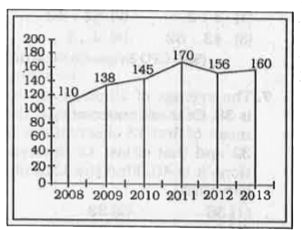
The decrease in percentage of passed students from 2011 to 2012 approximately isA8.25%B8.27%C8.24%D8.22%
No. of students and % of students passed out of those who appeared are given for two subjects from year 2011 to 2015 in a college XYZ.
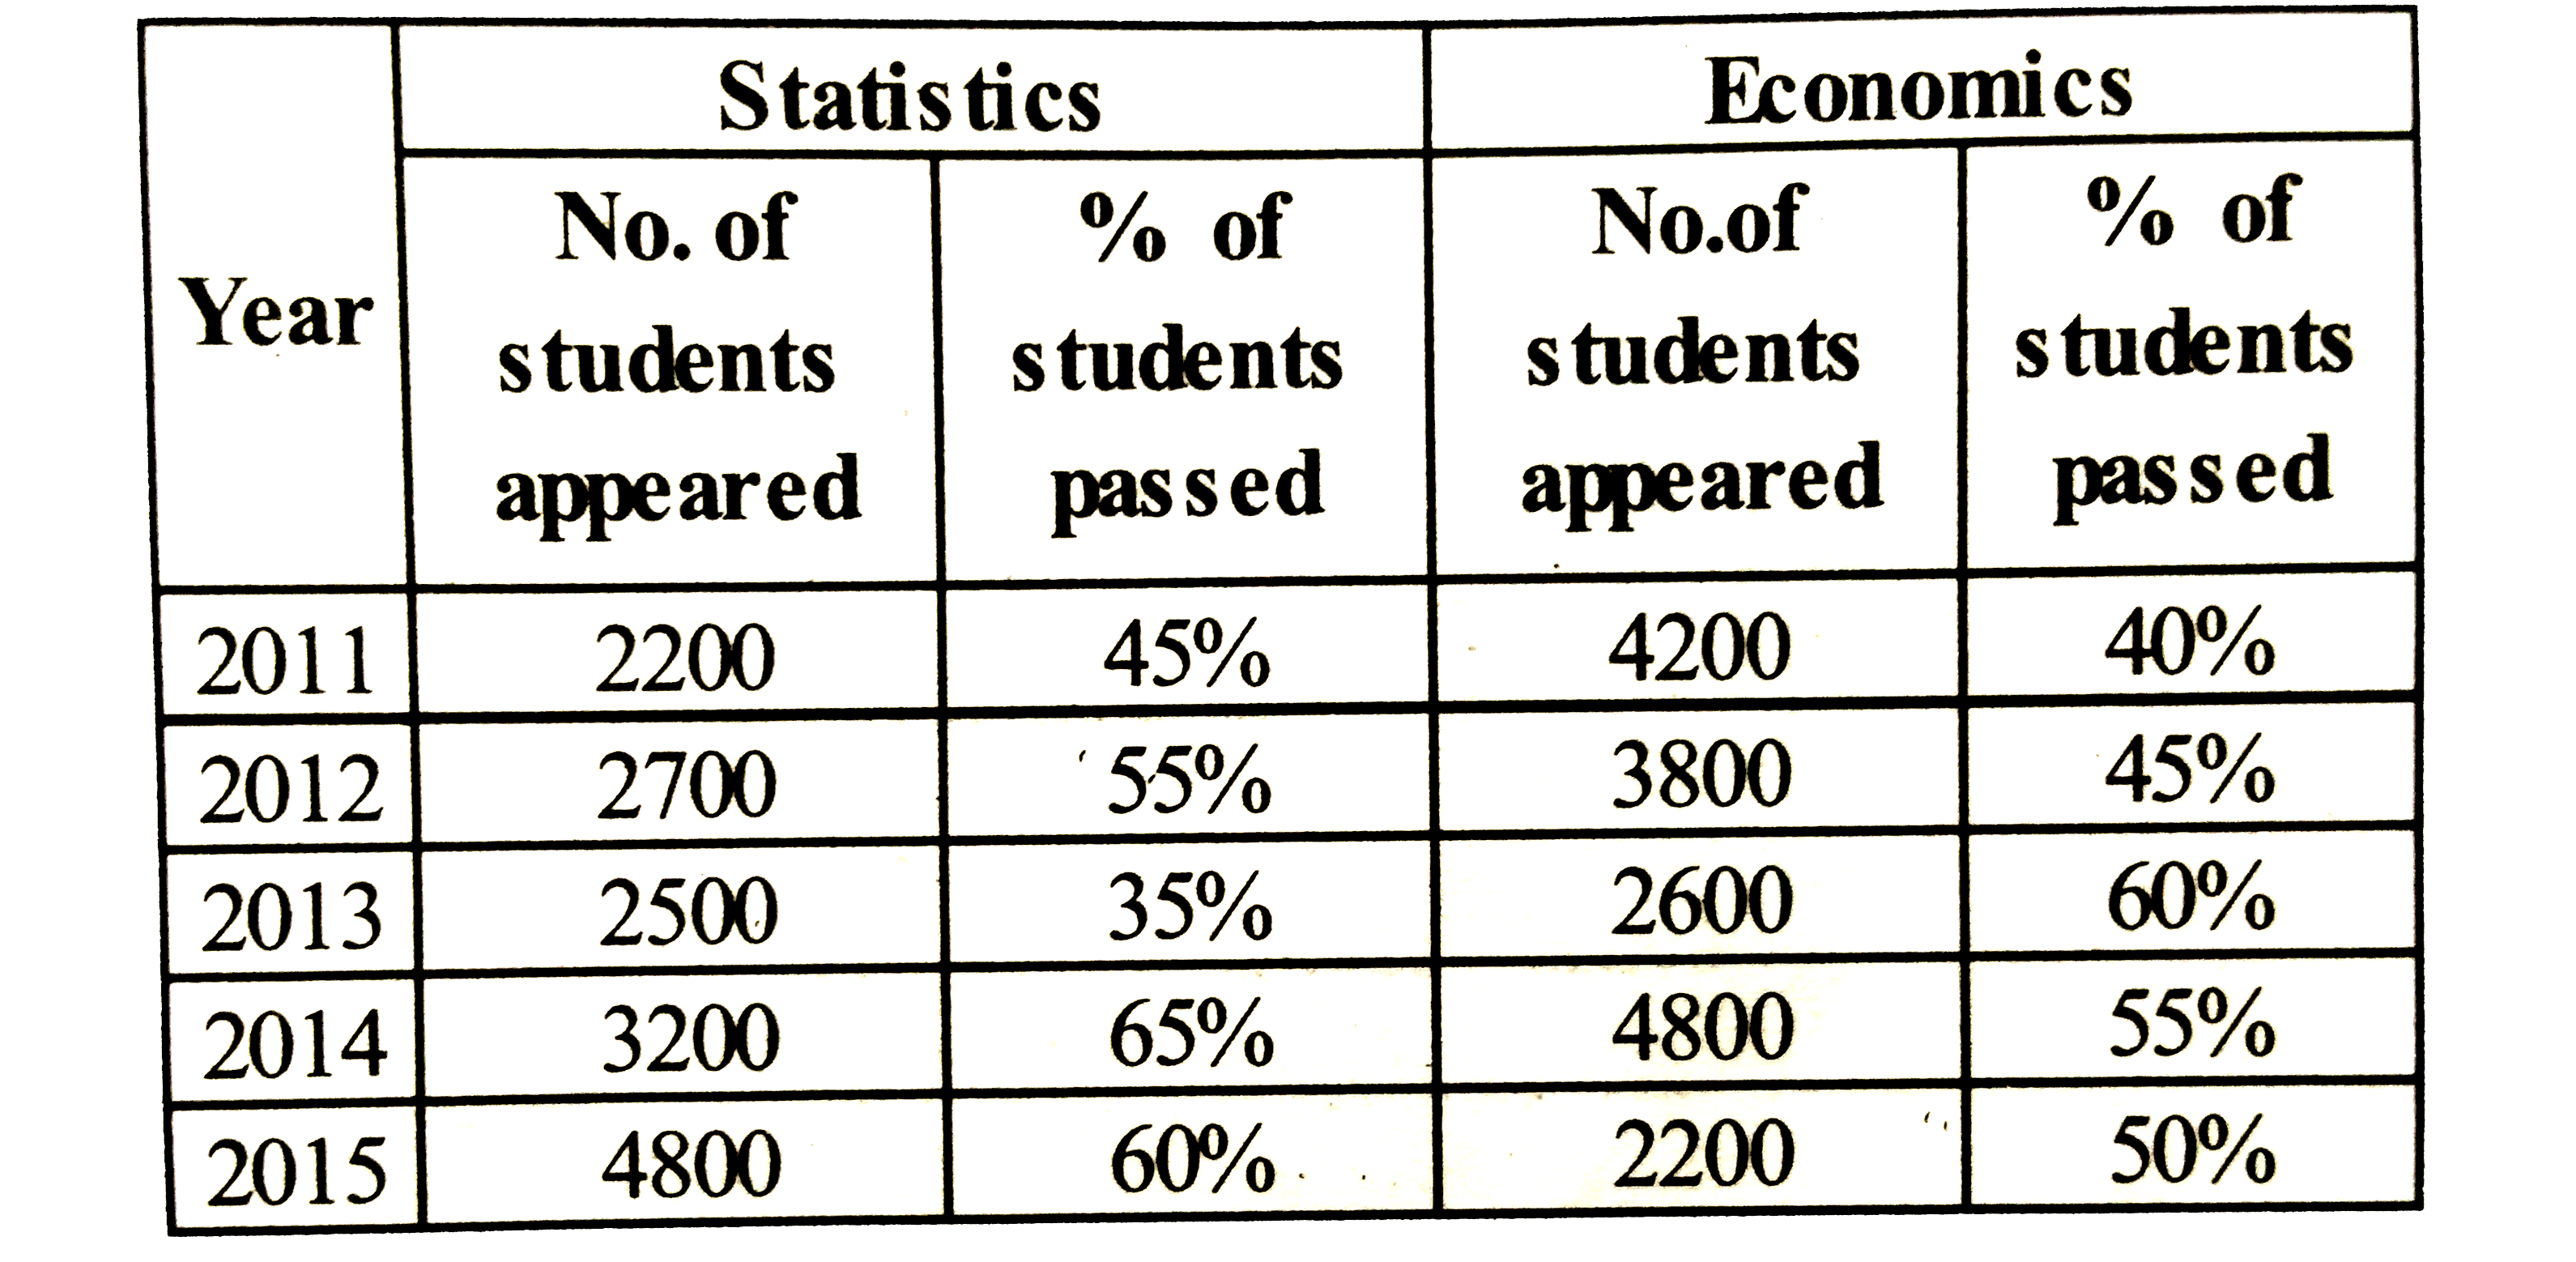
Find the avearage number of students appeared in Economics from year 2011 to 2014 together ?
View SolutionThe number of students appearing for the Aptitude Test from Town E is approximately what per cent of the total number of students appearing for the Aptitude Test from all the towns together? (a) 15 (b) 17 (c) 19 (d) 21 (e) 23
View SolutionThe number of students appeared for the scholarship exam from School D is approximately what percent of the total number of students appeared for the exam from all the schools together? (a) 12 (b) 24 (c) 29 (d) 18 (e) 8
View SolutionStudy the following table and answer question.
Number of students appeared in an examination from five cities :
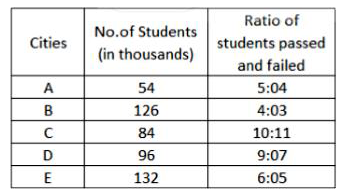
The ratio of the total number of students passed in the examination from cities A and D to that of students failed from cities B and E ?
View SolutionStudy the following table and answer question.
Number of students appeared in an examination from five citie s:
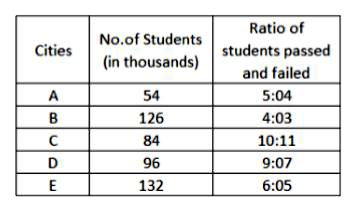
The total number of students who appeared in the examination from cities C and D is what percent more than the total number of students who failed in cities A, B and E ? (nearest to an integer)
View Solution
