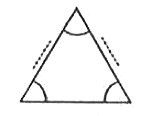
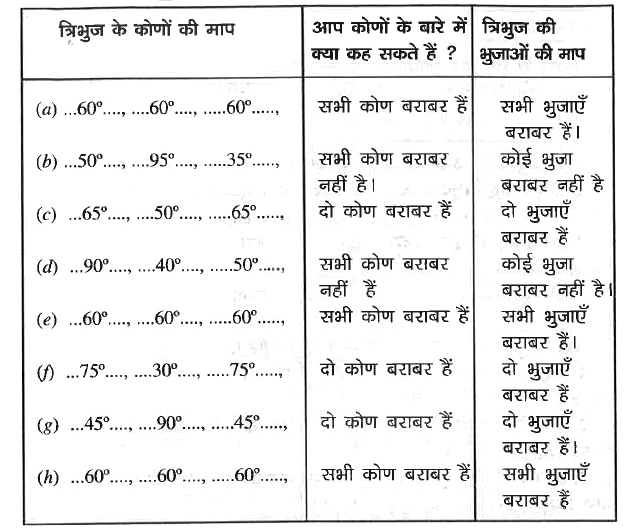
नीचे दी हुई सारणी को पूरा कीजिए और इस सारणी को देखकर ही समीकरण 5t = 35 का हल ज्ञात कीजिए।

The correct Answer is:t = 7 हल है।
Step by step video & image solution for नीचे दी हुई सारणी को पूरा कीजिए और इस सारणी को देखकर ही समीकरण 5t = 35 का हल ज्ञात कीजिए। by Maths experts to help you in doubts & scoring excellent marks in Class 6 exams.
Updated on:21/07/2023Topper's Solved these Questions
- बीजगणित BOOK - MBD PUBLICATIONCHAPTER - बीजगणित EXERCISE - वस्तुनिष्ठ प्रश्न
10 Videos
- बीजगणित BOOK - MBD PUBLICATIONCHAPTER - बीजगणित EXERCISE - प्रश्नावली 11.4
17 Videos
- प्रारंभिक आकारों को समझना BOOK - MBD PUBLICATIONCHAPTER - प्रारंभिक आकारों को समझना EXERCISE - इन्हे कीजिए
20 Videos
- भिन्नBOOK - MBD PUBLICATIONCHAPTER - भिन्नEXERCISE - वस्तुनिष्ठ प्रश्न
20 Videos
Similar Questions
गणित वह शाखा जिसमें हमने संख्याओं का अध्ययन किया, कहलाती है :-
View Solutionसरिता की वर्तमान आयु y वर्ष लीजिए।
आज से 5 वर्ष बाद उसकी आयु क्या होगी ?
View Solutionनीचे दिए गए त्रिभुजों के कोणों और भुजाओं को क्रमशः चाँदे और रूलर से मापकर दी हुई सारणी में इनकी मापो को भरिए :


उपरोक्त कोण, त्रिभुज और उनकी भुजाओं की मापो को ध्यानपूर्वक देखिए । क्या इनके बारे में कोई बात कही जा सकती है ?
View Solution8 घंटे एक दिन की कौन-सी भिन्न है ?
View SolutionHow many lines of symmetry does the above figure have ?
View SolutionWhich of the following are correct chain isomers of butane ? (i)
View SolutionDetermine the point of symmetry of a regular hexagon.
View SolutionDtermine the images of the following figure about the given line :
View SolutionMatch the following Column A to Column B

View SolutionMatch the following Column A to Column B

View SolutionMatch the following Column A to Column B

View SolutionFind the area of the figure given below.

View SolutionThe area of the shaded part in the figure given below is ______.

View SolutionThe inequation represented by the graph given below is :
View SolutionThe inequation that best describes the graph given below is _________
View SolutionThe inequation that best describes the following graph is _________
View Solution
