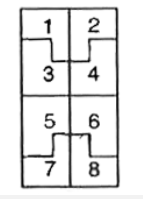
नीचे दिए गए प्रत्येक आयत जिसकी लंबाई 6 cm और चौड़ाई 4 cm है। सर्वांगसम बहुभुजों से मिलकर बने हैं। प्रत्येक बहुभुज का क्षेत्रफल ज्ञात कीजिए।

The correct Answer is:3cm2
Step by step video & image solution for नीचे दिए गए प्रत्येक आयत जिसकी लंबाई 6 cm और चौड़ाई 4 cm है। सर्वांगसम बहुभुजों से मिलकर बने हैं। प्रत्येक बहुभुज का क्षेत्रफल ज्ञात कीजिए। by Maths experts to help you in doubts & scoring excellent marks in Class 7 exams.
Updated on:21/07/2023Topper's Solved these Questions
- परिमाप और क्षेत्रफलBook:MBD PUBLICATIONChapter:परिमाप और क्षेत्रफलExercise:प्रश्न
Explore 6 Videos
- परिमाप और क्षेत्रफलBook:MBD PUBLICATIONChapter:परिमाप और क्षेत्रफलExercise:बहुविकल्पी प्रश्न
Explore 18 Videos
- त्रिभुजों की सर्वांगसमता Book:MBD PUBLICATIONChapter:त्रिभुजों की सर्वांगसमता Exercise:बहुविकल्पी प्रश्न
Explore 6 Videos
- परिमेय संख्याएँ Book:MBD PUBLICATIONChapter:परिमेय संख्याएँ Exercise:बहुविकल्पी प्रश्न (निम्नलिखित में प्रत्येक प्रश्न के उत्तर के लिए दिए है सही उत्तर का चयन कीजिए)
Explore 17 Videos
Similar Questions
निम्न को बदलिए:
1m2 को dm2 में
View Solutionआयत का परिमाप = 2 (.........)
View Solutionनिम्न में से कौन सी वस्तुएँ सर्वांगसम हैं : -
View Solutionनिम्नलिखित में से कौन सी प्राकृत संख्या नहीं है?
View SolutionHow many lines of symmetry does the above figure have ?
View SolutionWhich of the following are correct chain isomers of butane ? (i)
View SolutionDetermine the point of symmetry of a regular hexagon.
View SolutionDtermine the images of the following figure about the given line :
View SolutionIn the figure above (not to scale), ¯¯¯¯¯¯AB⊥¯¯¯¯¯¯CDandAD is the bisector of ∠BAE.AB=3cm and AC=5cm. Find CD.
View SolutionIn the following figures, PT=4 cm , TQ=6cm and RT=3 cm , then TS=_______________.
View SolutionMatch the following Column A to Column B

View SolutionMatch the following Column A to Column B

View SolutionMatch the following Column A to Column B

View SolutionThe inequation represented by the graph given below is :
View SolutionThe inequation that best describes the graph given below is _________
View SolutionThe inequation that best describes the following graph is _________
View Solution
