कवकों तथा शैवालों के बीच सहजीवता को दर्शाता है
फर्न
जिम्नोस्पर्म
एंजियोस्पर्म
लाइकेन
Step by step video, text & image solution for कवकों तथा शैवालों के बीच सहजीवता को दर्शाता है by Biology experts to help you in doubts & scoring excellent marks in Class 9 exams.
Updated on:21/07/2023Topper's Solved these Questions
- जीवों में विविधताBOOK - KIRAN PUBLICATIONCHAPTER - जीवों में विविधताEXERCISE - अन्य महत्वपूर्ण प्रश्न एवं उनके उत्तर (दीर्घ उत्तरीय प्रश्न)
14 Videos
- स्वास्थ्य एवं रोग BOOK - KIRAN PUBLICATIONCHAPTER - स्वास्थ्य एवं रोग EXERCISE - अन्य महत्वपूर्ण प्रश्न एवं उनके उत्तर ( दीर्घ उत्तरीय प्रश्न )
10 Videos
Similar Questions
वर्गीकरण का क्या महत्त्व है?
View Solutionरेबीज से क्या तात्पर्य है ? इस रोग के क्या लक्षण हैं?
View Solutionसदिशों ¯a+¯b असंरेखी सदिशों ¯a और ¯b के बीच के कोण को समद्विभाजित करता है, यदि ...........
View Solutionमाना z=(√32+i2)5+(√32−i2)5 है। यदि R(z) तथा I(z) क्रमश: z के वास्तविक तथा काल्पनिक भागो को दर्शाता है, तो
View Solutionयदि एक अतिपरवलय के संयुग्मी अक्ष की लम्बाई 5 है तथा इसकी नाभिको के बीच की दुरी 13 है, तो इस अतिपरवलय की उत्केंद्रता है
View Solutionसमान्तर रेखाओं ax+by+c=0 तथा ax+by+d=0 के बीच की दुरी निकालें।
View Solutionमीरा के श्री कृष्ण के प्रति अनन्य प्रेम को दर्शाता है
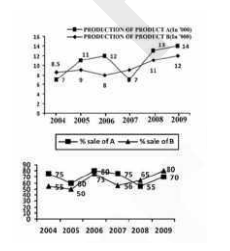
View SolutionThe line graph shows the production of product A and B (in thousands) during the period 2004 to 2009 and the second line Graph shows the percentage sale of these products.
यह पंक्ति आलेख 2004 से 2009 की अवधि के दौरान वस्तु A एवं B के उत्पादन ( हज़ार में ) को दर्शाता है तथा दूसरा पंक्ति आलेख इन वस्तुओं की प्रतिशत बिक्री को दर्शाता है | In the given line graph, what is the total sale of Product A in the year 2005 and 2009 taken together?
दिए गए पंक्ति आलेख के अनुसार, वर्ष 2005 तथा 2009 को मिलाकर वस्तु A की कुल बिक्री कितनी है ?
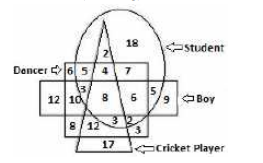
View SolutionIn the following diagram, the triangle represents ‘cricket players’, the circle represents ‘students’, the rectangle represents ‘boys’ and the square represents ‘dancers’. The numbers in different segments show the number of persons.
निम्नलिखित आरेख में, त्रिभुज क्रिकेट खिलाड़ियों' को दर्शाता है, वृत्त 'छात्रों' को दर्शाता है, आयत ' लड़कों? को दर्शाता है तथा वर्ग 'नर्तकों' को दर्शाता है | विभिन्न खंडो में दी गयी संख्याएं लोगों की संख्या के बारे में बताती हैं How many students are dancers and cricket players but not boys?
कितने छात्र नर्तक और क्रिकेट खिलाड़ी हैं लेकिन लड़के नहीं हैं ?
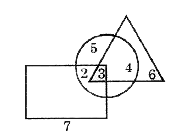
View SolutionIn the following figure, Circle represents Surgeons, Triangle represents Doctors, Rectangle represents Professionals and Pentagon represents Indians. Which number represents Indian Doctors who are also Surgeons?/
/नीचे दी गयी आकृति में, वृत्त “सर्जन' को दर्शाता है, त्रिभुज 'चिकित्सकों' को दर्शाता है, आयत “पेशेवरों' को दर्शाता है तथा पंचभुज 'भारतीयों' को दर्शाता है | कौन सी संख्या उन भारतीय चिकित्सकों को दर्शाती है जो सर्जन भी हैं ?
View SolutionFive persons Lopa, Kripa, Sumi, Jani and Sush are sitting in a straight line facing north. Sush is to the immediate left of Sumi, Jani is to the immediate right of Lopa. Kripa is between Sush and Jani. Who is sitting between Lopa and Kripa? पाँच व्यक्ति लोपा, कृपा, सुमी, जानी तथा सुष एक सीधी रेखा में उत्तर की ओर मुख करके बैठे हुए हैं। सुष, सुमी के तुरंत बाएँ को है, जानी, लोपा के तुरंत दाएँ को है। कृपा सुष तथा जानी के बीच है। लोपा तथा कृपा के बीच कौन बैठा हुआ है?
View SolutionIn the given figure, the circle represents youths, the triangle represents the persons who are in job and the rectangle represents illiterate persons.
Which of the following numbers depicts illiterate youths who have a job?

View SolutionWhich of the following venn-diagram correctly represent Brinjal, Meat and Vegetable?
निम्नलिखित आकृतियों में से कौन-सा बैंगन, माँस, सब्जियों के बीच सम्बन्ध को दर्शाता है?
View SolutionWhich one of the following diagrams represent the correct relationship between DOCTORS, SURGEONS and NURSES निम्नलिखित में से कौन-सा आरेख डॉक्टर, सर्जनों तथा नसों के बीच सही संबंध को दर्शाता है?
View SolutionThe price of an article increases by 20% every year. If the difference between the prices at the end of the third and fourth years is Rs. 259.20, then 40% of the price (In Rs.) at the end of the second year is :
एक वस्तु की कीमत हर वर्ष 20% बढ़ जाती है | यदि तीसरे और चौथे वर्ष की कीमतों में 259.20 रुपये का अंतर है, तो दूसरे वर्ष के अंत में इसकी कीमत का 40% होगा :
View SolutionIdentify the diagram that best represents the relation ship among the classes given below. Criminals, Judges, Thieves
वह आरेख चुनिए जो निम्नलिखित वर्गों के बीच सही सम्बन्ध को दर्शाता है।
अपराधी, न्यायाधीश, चोर
View Solution
