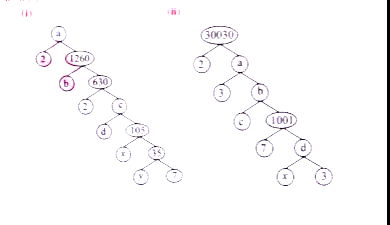
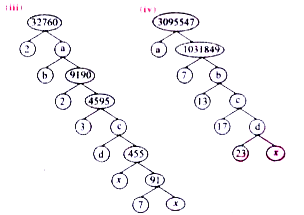
निम्नलिखित गुणनखंड वृक्ष में लुप्त संख्याओं a, b, c, d, x, y के मान ज्ञात करें।


The correct Answer is:(i) a=2520 , b =2, c=315, d=3, x=3, y=5 ; (ii) a=15015, b=5005, c=5, d=143, x=11; (iii) a=3, b=147407, c=11339, d=667, x=29
Step by step video, text & image solution for निम्नलिखित गुणनखंड वृक्ष में लुप्त संख्याओं a, b, c, d, x, y के मान ज्ञात करें। by Maths experts to help you in doubts & scoring excellent marks in Class 10 exams.
Updated on:21/07/2023Topper's Solved these Questions
- वास्तविक संख्याएँ BOOK - KIRAN PUBLICATIONCHAPTER - वास्तविक संख्याएँ EXERCISE - EXERCISE-1.3
13 Videos
- वास्तविक संख्याएँ BOOK - KIRAN PUBLICATIONCHAPTER - वास्तविक संख्याएँ EXERCISE - EXERCISE-1.4
36 Videos
- वास्तविक संख्याएँ BOOK - KIRAN PUBLICATIONCHAPTER - वास्तविक संख्याएँ EXERCISE - वस्तुनिष्ठ प्रश्न
17 Videos
- बहुपदBOOK - KIRAN PUBLICATIONCHAPTER - बहुपदEXERCISE - वस्तुनिष्ठ प्रश्न
9 Videos
- वृत्तBOOK - KIRAN PUBLICATIONCHAPTER - वृत्तEXERCISE - वस्तुनिष्ट प्रश्न
14 Videos
Similar Questions
सिद्ध करें कि √2 एक अपरिमेय संख्या है|
View Solutionबिना लम्बी विभाजन प्रक्रिया किये बतायें कि नीचे दी गई परिमेय संख्याओं के दशमलव प्रसार सांत हैं या असांत|
(i) 178, (ii) 38, (iii) 29343
(iv) 64455, (v) 615,
View Solution√2 है:
View Solutionद्विघात बहुपंद x2−5x+6 के शून्यक है- .
View Solutionयदि एक बिंदु P से O केंद्र वाले वृत्त पर PA , PB स्पर्श रेखाएँ परस्पर 80∘ के कोण पर झुकी हों, तो ∠POA बराबर है :
View SolutionHow many lines of symmetry does the above figure have ?
View SolutionWhich of the following are correct chain isomers of butane ? (i)
View SolutionDetermine the point of symmetry of a regular hexagon.
View SolutionDtermine the images of the following figure about the given line :
View SolutionMatch the following Column A to Column B

View SolutionMatch the following Column A to Column B

View SolutionMatch the following Column A to Column B

View SolutionFind the area of the figure given below.

View SolutionThe inequation represented by the graph given below is :
View SolutionThe inequation that best describes the graph given below is _________
View SolutionThe inequation that best describes the following graph is _________
View Solution
