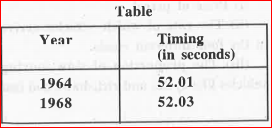
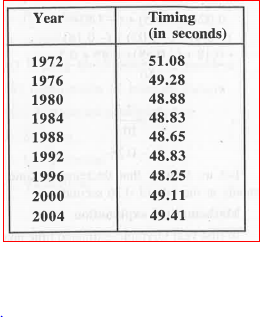
We have given the timings of the gold medalists in the 400-metre race from the time the event was included in the Olympics, in table below. Contruct a mathematical model relating years and timings. Use it to estimate the timing in the next Olympics.

 Solution in Punjabi
Step by step video & image solution for We have given the timings of the gold medalists in the 400-metre race from the time the event was included in the Olympics, in table below. Contruct a mathematical model relating years and timings. Use it to estimate the timing in the next Olympics. by Maths experts to help you in doubts & scoring excellent marks in Class 9 exams.
Topper's Solved these Questions
- BOOK - PSEBCHAPTER - INTRODUCTION TO MATHEMATICAL MODELLINGEXERCISE - EXAMPLE4videos
INTRODUCTION TO MATHEMATICAL MODELLING
- BOOK - PSEBCHAPTER - HERON’S FORMULAEXERCISE - EXAMPLE6videos
HERON’S FORMULA
- BOOK - PSEBCHAPTER - LINEAR EQUATIONS IN TWO VARIABLESEXERCISE - EXAMPLE19videos
LINEAR EQUATIONS IN TWO VARIABLES
Similar Questions
I travelled 432 kilometres on 48 litres of petrol in my car. I have to go by my car to a place which is 180 km away. How much petrol do I need?
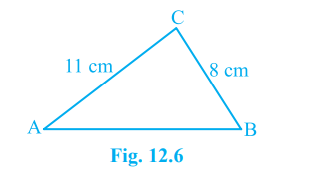
01:37View SolutionFind the area of a triangle, two sides of which are 8 cm and 11 cm and the perimeter is 32 cm (see Fig. 12.6).
 06:07View Solution
Write the following equations in the form ax + by + c = 0 and indicate the values of a, b and c in each case: 2x+3y=4.37
02:11View SolutionHow many lines of symmetry does the above figure have ?
01:31View SolutionWhich of the following are correct chain isomers of butane ? (i)
02:45View SolutionDetermine the point of symmetry of a regular hexagon.
02:17View SolutionDtermine the images of the following figure about the given line :
05:41View SolutionMatch the following Column A to Column B
 03:28View Solution
Match the following Column A to Column B
 02:31View Solution
Match the following Column A to Column B
 02:21View Solution
Find the area of figure given below.
 02:03View Solution
Find the perimeter of the figure given below.
 02:10View Solution
Find the area of the figure given below.
 02:17View Solution
The area of the shaded part in the figure given below is ______.
 02:10View Solution
The inequation represented by the graph given below is :
04:23View SolutionThe inequation that best describes the graph given below is _________
03:10View Solution

