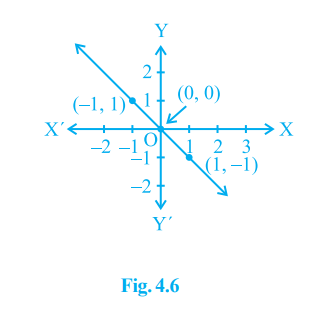
From the choices given below, choose the equation whose graphs are given :-For Fig. 4. 6
 Solution in Punjabi
y=x
x+y=0
y=2x
2+3y=7x
Step by step video & image solution for From the choices given below, choose the equation whose graphs are given :-For Fig. 4. 6 by Maths experts to help you in doubts & scoring excellent marks in Class 9 exams.
Topper's Solved these Questions
- BOOK - PSEBCHAPTER - LINEAR EQUATIONS IN TWO VARIABLESEXERCISE - EXAMPLE19videos
LINEAR EQUATIONS IN TWO VARIABLES
- BOOK - PSEBCHAPTER - INTRODUCTION TO MATHEMATICAL MODELLINGEXERCISE - EXAMPLE4videos
INTRODUCTION TO MATHEMATICAL MODELLING
- BOOK - PSEBCHAPTER - LINES AND ANGLESEXERCISE - EXAMPLE8videos
LINES AND ANGLES
Similar Questions
Write the following equations in the form ax + by + c = 0 and indicate the values of a, b and c in each case: 2x+3y=4.37
02:11View SolutionI travelled 432 kilometres on 48 litres of petrol in my car. I have to go by my car to a place which is 180 km away. How much petrol do I need?
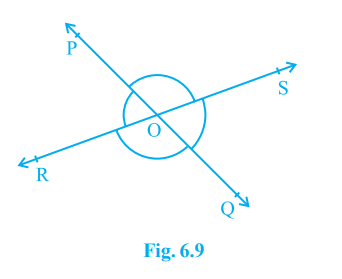
01:31View SolutionIn Fig. 6.9, lines PQ and RS intersect each other at point O. If ∠POR:∠ROQ=5:7, find all the angles.
 02:45View Solution
Determine the point of symmetry of a regular hexagon.
02:17View SolutionDtermine the images of the following figure about the given line :
05:41View SolutionMatch the following Column A to Column B
 03:28View Solution
Match the following Column A to Column B
 02:31View Solution
Match the following Column A to Column B
 02:21View Solution
Find the area of figure given below.
 02:21View Solution
Find the perimeter of the figure given below.
 02:03View Solution
Find the area of the figure given below.
 02:10View Solution
Calculate the volume of the given solid.
ltimg src="https://d10lpgp6xz60nq.cloudfront.net/physics_images/PS_MATH_VII_C06_E03_002_Q01.png" width="80%"gt02:17View SolutionThe area of the shaded part in the figure given below is ______.
 02:10View Solution
The inequation represented by the graph given below is :
04:23View SolutionThe inequation that best describes the graph given below is _________
01:13View SolutionThe inequation that best describes the following graph is _________
01:59View Solution

