संलग्न आकृति में ∠A , AD का अर्द्धक है। यदि BD = 4 cm, DC = 3 cm और AB = 6 cm हो, तो AC ज्ञात करो।

The correct Answer is:AC = 4.5 cm
Step by step video & image solution for संलग्न आकृति में angleA , AD का अर्द्धक है। यदि BD = 4 cm, DC = 3 cm और AB = 6 cm हो, तो AC ज्ञात करो। by Maths experts to help you in doubts & scoring excellent marks in Class 10 exams.
Updated on:21/07/2023Topper's Solved these Questions
- त्रिभुजBOOK - DEEPAK PUBLICATIONCHAPTER - त्रिभुजEXERCISE - परीक्षोपयोगी अन्य महत्त्वपूर्ण प्रश्न
21 Videos
- त्रिकोणमिति के कुछ अनुप्रयोग BOOK - DEEPAK PUBLICATIONCHAPTER - त्रिकोणमिति के कुछ अनुप्रयोग EXERCISE - अभ्यास के लिए प्रश्न
14 Videos
- दो चार वाले रैखिक समीकरण युग्म BOOK - DEEPAK PUBLICATIONCHAPTER - दो चार वाले रैखिक समीकरण युग्म EXERCISE - अभ्यास के लिए प्रश्न
74 Videos
Similar Questions
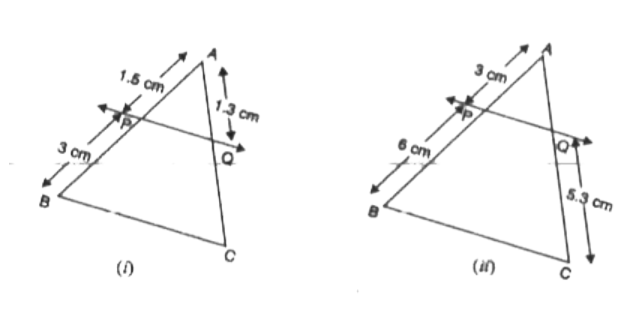
यदि आकृति (1) और (i) में, PQ || BC हो, तो (i) में QC और (ii) में AQ ज्ञात कीजिए-

View Solutionकिसी ऊर्ध्वाधर मीनार के पाद बिन्दु से 20 मीटर दूर धरती पर एक बिन्दु से मीनार के शिखर का उन्नयन कोण 60∘है | मीनार की ऊँचाई क्या है ?
View Solutionदो रेल पटरियां , समीकरणों x+2y−4=0 और 2x+4y−12=0 द्वारा निरूपित की गई है| इस स्थिति को ज्यामितीय रूप से व्यक्त कीजिए।
View SolutionHow many lines of symmetry does the above figure have ?
View SolutionWhich of the following are correct chain isomers of butane ? (i)
View SolutionDetermine the point of symmetry of a regular hexagon.
View SolutionDtermine the images of the following figure about the given line :
View SolutionIn the figure above (not to scale), ¯¯¯¯¯¯AB⊥¯¯¯¯¯¯CDandAD is the bisector of ∠BAE.AB=3cm and AC=5cm. Find CD.
View SolutionIn the following figures, PT=4 cm , TQ=6cm and RT=3 cm , then TS=_______________.
View SolutionMatch the following Column A to Column B

View SolutionMatch the following Column A to Column B

View SolutionMatch the following Column A to Column B

View SolutionThe inequation represented by the graph given below is :
View SolutionThe inequation that best describes the graph given below is _________
View SolutionThe inequation that best describes the following graph is _________
View SolutionWhich inequations represent the shaded region in the given figure
View Solution
