दी गई आकृति में दो संकेन्द्रीय वृत्तों की त्रिज्याएँ 7 सेमी तथा 3.5 सेमी है। छायांकित भाग का क्षेत्रफल ज्ञात करें |[π=227]
![दी गई आकृति में दो संकेन्द्रीय वृत्तों की त्रिज्याएँ 7 सेमी तथा 3.5 सेमी है। छायांकित भाग का क्षेत्रफल ज्ञात करें |[pi = (22)/(7) ]](https://d10lpgp6xz60nq.cloudfront.net/physics_images/SCH_HIN_MAT_IX_C29_SLV_036_Q01.png)
The correct Answer is:9.625cm2
Step by step video & image solution for दी गई आकृति में दो संकेन्द्रीय वृत्तों की त्रिज्याएँ 7 सेमी तथा 3.5 सेमी है। छायांकित भाग का क्षेत्रफल ज्ञात करें |[pi = (22)/(7) ] by Maths experts to help you in doubts & scoring excellent marks in Class 10 exams.
Topper's Solved these Questions
- BOOK - DEEPAK PUBLICATIONCHAPTER - वृत्तों से संबंधित क्षेत्रफल EXERCISE - परीक्षोपयोगी अन्य महत्वपूर्ण प्रश्न22videos
वृत्तों से संबंधित क्षेत्रफल
- BOOK - DEEPAK PUBLICATIONCHAPTER - वृत्तEXERCISE - अभ्यास के लिए प्रश्न15videos
वृत्त
- BOOK - DEEPAK PUBLICATIONCHAPTER - समांतर श्रेढ़ीEXERCISE - अभ्यास के लिए प्रश्न60videos
समांतर श्रेढ़ी
Similar Questions
एक कोल्हू का बैल 3m लम्बी रस्सी से बंधा हुआ है। वह 14 चक्करों में कितनी दुरी तय करेगा ?
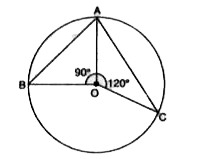
01:37View Solutionआसन्न आकृति में, तीन बिंदु A, B और C किसी वृत्त पर इस प्रकार स्थित हैं कि जीवाएँ AB और AC केंद्र O पर क्रमशः 90∘ और 120∘ के कोण अंतरित करती हैं। ∠BAC ज्ञात कीजिए।
 06:07View Solution
ज्ञात कीजिए कि निम्नलिखित में से कौन-कौन से अनुक्रम समांतर श्रेढ़ी में हैं, जो समांतर श्रेढ़ी में हैं उनका सार्व अंतर ज्ञात कीजिए-
7,3,−1,−5,−9,……..02:11View SolutionHow many lines of symmetry does the above figure have ?
01:31View SolutionWhich of the following are correct chain isomers of butane ? (i)
02:45View SolutionDetermine the point of symmetry of a regular hexagon.
02:17View SolutionDtermine the images of the following figure about the given line :
05:41View SolutionMatch the following Column A to Column B
 02:21View Solution
Match the following Column A to Column B
 02:03View Solution
Match the following Column A to Column B
 02:10View Solution
Find the area of the figure given below.
 02:17View Solution
The area of the shaded part in the figure given below is ______.
 02:10View Solution
The inequation represented by the graph given below is :
04:23View SolutionThe inequation that best describes the graph given below is _________
01:13View SolutionThe inequation that best describes the following graph is _________
03:12View SolutionWhich inequations represent the shaded region in the given figure
05:46View Solution

