Following are the marks obtained by 30 students in a examination

Taking class intervals 0−10,10−20,…..40−50 construct a frequency table.
The correct Answer is:(##NTNMATHIXC14E01004_A01##)
Step by step video & image solution for Following are the marks obtained by 30 students in a examination Taking class intervals 0-10, 10-20,….. 40-50 construct a frequency table. by Maths experts to help you in doubts & scoring excellent marks in Class 9 exams.
Updated on:21/07/2023Topper's Solved these Questions
- STATISTICSBOOK - NAGEEN PRAKASHAN ENGLISHCHAPTER - STATISTICSEXERCISE - EXERCISE 14B
13 Videos
- STATISTICSBOOK - NAGEEN PRAKASHAN ENGLISHCHAPTER - STATISTICSEXERCISE - Exercise 14c
20 Videos
- STATISTICSBOOK - NAGEEN PRAKASHAN ENGLISHCHAPTER - STATISTICSEXERCISE - Problems From NCERT/exemplar
22 Videos
- QUADRILATERALSBOOK - NAGEEN PRAKASHAN ENGLISHCHAPTER - QUADRILATERALSEXERCISE - Revision Exercise (long Answer Questions)
5 Videos
- SURFACE AREA AND VOLUMEBOOK - NAGEEN PRAKASHAN ENGLISHCHAPTER - SURFACE AREA AND VOLUMEEXERCISE - Revision Exercise (long Answer Questions)
10 Videos
Similar Questions
The following table shows the marks scored by 140 students in an examination of a certain paper: Marks: 0-10 10-20 20-30 30-40 40-50 No. of students: 20 24 40 36 20 Calculate the average marks by using the assumed mean deviation method.
View SolutionThe marks obtained by 32 students of a class are given below. Prepare a frequency table with class intervals 31−40,41−50,….. etc.

View SolutionThe following table gives the marks scored by 100 students in an entrance examination. Marks: 0-10 10-20 20-30 30-40 40-50 50-60 60-70 70-80 No. of Students (Frequency): 4 10 16 22 20 18 8 2 Represent this data in the form of a histogram.
View SolutionGiven below are the marks obtained by 40 students in an examination :
40 56 24 41 51 22 59 12 26 46
51 14 23 59 58 29 41 35 36 40
42 43 36 33 38 52 23 24 13 55
18 54 20 57 30 24 43 50 26 15
Taking class intervals 10−20,20−30,.....,50−60, construct a frequency table for the above distribution.
View SolutionGiven below are the marks obtained by 30 students of a class, Using the class intervals of equal class size in which one class interval is 30-40 (excluding 40), construct a frequency table.
427439484280353852813172655877827965473064563948606372504635
View SolutionThe following table gives the marks scored by 378 students in an entrance examination : Marks 0-10 10-20 20-30 30-40 40-50 50-60 60-70 70-80 80-90 90-100 No. of Students 3 12 36 76 97 85 39 12 12 6 From this table form (i) less than series, and (ii) the more than series.
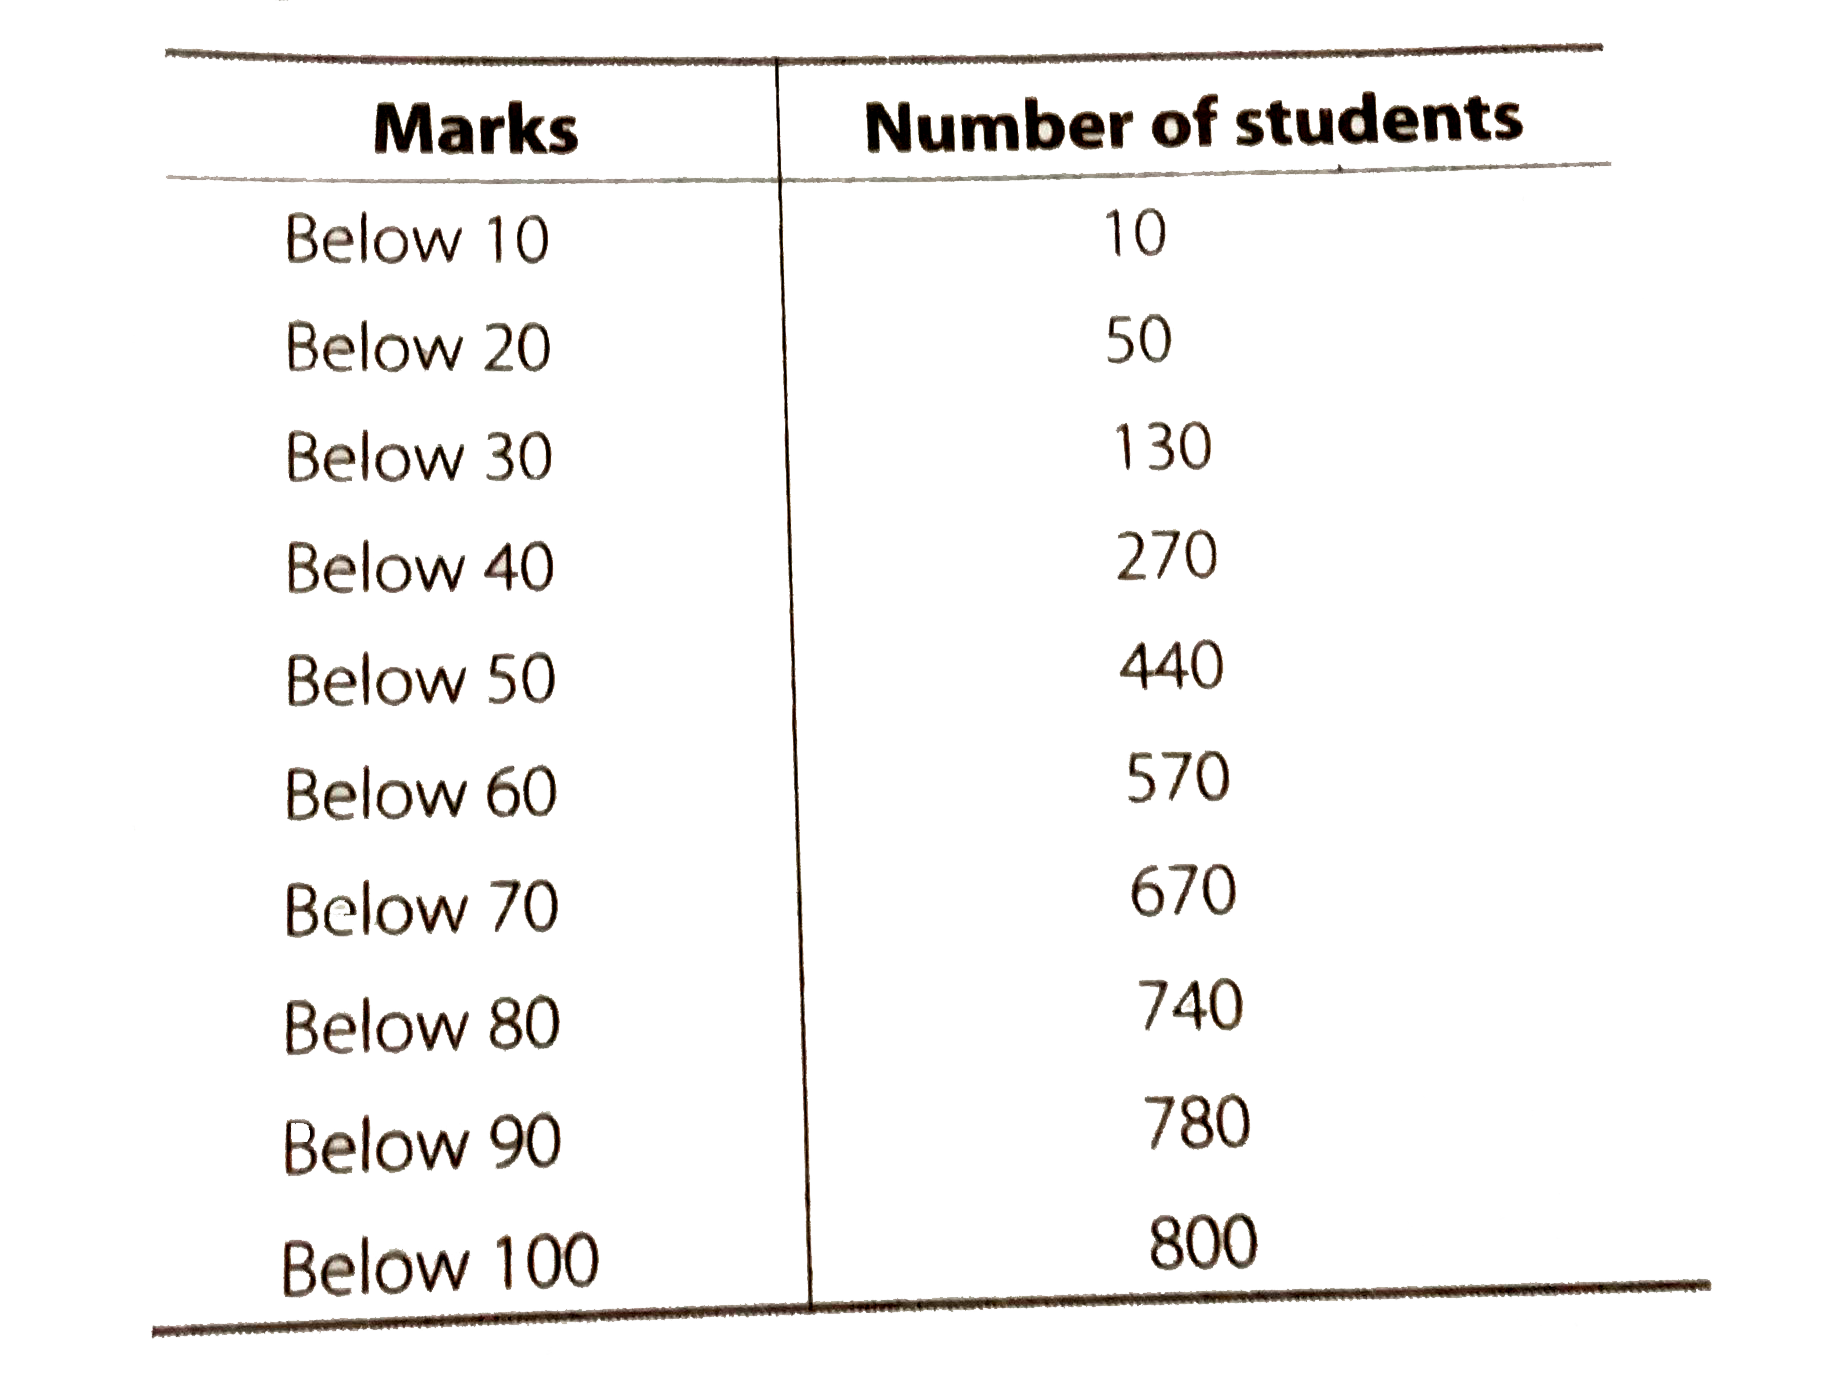
View SolutionThe following table show tha cumulative frequency distribution of marks of 800 students in an examination.

Construct a frequency distribution table for the data above.
View SolutionFollowing are the marks obtained by 30 students in an examination :
152089101617202430444738364027252830197112131413747232017
Taking class intervals 0-10 , 10-20,............ ., 40-50, construct a frequency table.
View SolutionThe table shows the marks obtained by 25 students in a class test. Find the mean of the marks obtained

View SolutionFind the mode of the following distribution of marks obtained by 80 students: Marks obtained 0-10 10-20 20-30 30-40 40-50 No. of students 6 10 12 32 20
View Solution
