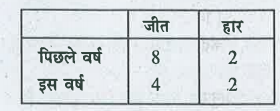
एक क्रिकेट टीम द्वारा खेले गए कुछ में प्रदर्शन निम्न प्रकार हैं

किस वर्ष में प्रदर्शन बेहतर था ?
ऐसा आप किस आधार पर कह सकते हैं ?
The correct Answer is:पिछले वर्ष टीम ने बेहतर प्रदर्शन किया क्योकि 8:2>4:2 अर्थात 4:1>2:1
Step by step video & image solution for एक क्रिकेट टीम द्वारा खेले गए कुछ में प्रदर्शन निम्न प्रकार हैं किस वर्ष में प्रदर्शन बेहतर था ?ऐसा आप किस आधार पर कह सकते हैं ? by Maths experts to help you in doubts & scoring excellent marks in Class 7 exams.
Updated on:21/07/2023Topper's Solved these Questions
- राशियों की तुलना BOOK - MBD PUBLICATIONCHAPTER - राशियों की तुलना EXERCISE - पाठ्य - पुस्तक प्रश्नावली 8.2
10 Videos
- राशियों की तुलना BOOK - MBD PUBLICATIONCHAPTER - राशियों की तुलना EXERCISE - पाठ्य - पुस्तक प्रश्नावली 8.2 (अभ्यास के लिए अतिरिक्त प्रश्न)
21 Videos
- राशियों की तुलना BOOK - MBD PUBLICATIONCHAPTER - राशियों की तुलना EXERCISE - पाठ्य - पुस्तक प्रश्नावली 8.1
3 Videos
- भिन्न एवं दशमलव BOOK - MBD PUBLICATIONCHAPTER - भिन्न एवं दशमलव EXERCISE - बहुवैकल्पिक प्रश्न
18 Videos
- रेखा एवं कोण BOOK - MBD PUBLICATIONCHAPTER - रेखा एवं कोण EXERCISE - सोचिए , चर्चा कीजिए एवं लिखिए
13 Videos
Similar Questions
दी गयी भिन्न संख्याओं को प्रतिशत में बदलो।
18
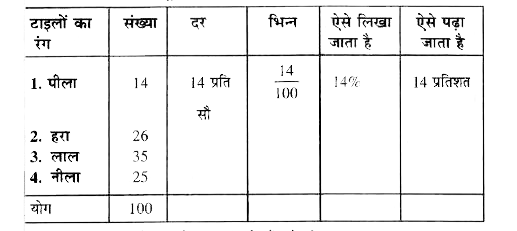
View Solutionनिम्न तालिका को पूरा कीजिए :

View Solutionअनुपात ज्ञात कीजिये :
रु 5 का 50 पैसे से
View Solutionनिचे प्रत्येक प्रश्न के चार चार उत्तर दिए गए है सही उत्तर का चयन करे
2−35=………..
View Solutionक्या दो न्यून कोण एक - दूसरे के पूरक हो सकते हैं ?
View SolutionHow many lines of symmetry does the above figure have ?
View SolutionWhich of the following are correct chain isomers of butane ? (i)
View SolutionDetermine the point of symmetry of a regular hexagon.
View SolutionDtermine the images of the following figure about the given line :
View SolutionMatch the following Column A to Column B

View SolutionMatch the following Column A to Column B

View SolutionMatch the following Column A to Column B

View SolutionFind the area of the figure given below.

View SolutionThe area of the shaded part in the figure given below is ______.

View SolutionThe inequation represented by the graph given below is :
View SolutionThe inequation that best describes the graph given below is _________
View Solution
