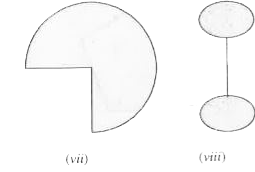
यहाँ पर कुछ आकृतियाँ दी गई हैं :


प्रत्येक का वर्गीकरण निम्नलिखित आधार पर कीजिए :
(a) साधारण वक्र (d) अवतल बहभुज
(b) उत्तल बहुभुज (e) बहुभुज
(c) साधारण बंद वक्र
The correct Answer is:(i), (ii), (v), (vi), (vii)
Step by step video & image solution for यहाँ पर कुछ आकृतियाँ दी गई हैं : प्रत्येक का वर्गीकरण निम्नलिखित आधार पर कीजिए : (a) साधारण वक्र (d) अवतल बहभुज (b) उत्तल बहुभुज (e) बहुभुज (c) साधारण बंद वक्र by Maths experts to help you in doubts & scoring excellent marks in Class 8 exams.
Updated on:21/07/2023Topper's Solved these Questions
- चतुर्भुजों को समझना BOOK - MBD PUBLICATIONCHAPTER - चतुर्भुजों को समझना EXERCISE - अभ्यास के लिए अतिरिक्त प्रश्न
41 Videos
- चतुर्भुजों को समझना BOOK - MBD PUBLICATIONCHAPTER - चतुर्भुजों को समझना EXERCISE - पाठ्य-पुस्तक प्रश्नावली 3.2
10 Videos
- चतुर्भुजों को समझना BOOK - MBD PUBLICATIONCHAPTER - चतुर्भुजों को समझना EXERCISE - बहुविकल्पी प्रश्न
16 Videos
- घातांक और घात BOOK - MBD PUBLICATIONCHAPTER - घातांक और घात EXERCISE - बहु-विकल्पीय प्रश्न
17 Videos
- ठोस आकारों का चित्रणBOOK - MBD PUBLICATIONCHAPTER - ठोस आकारों का चित्रणEXERCISE - बहु- विकल्पीय प्रश्न
11 Videos
Similar Questions
निम्नलिखित में से प्रत्येक में कितने विकर्ण हैं।
अवतल चतुर्भुज
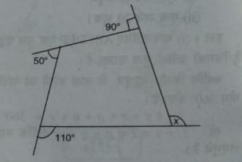
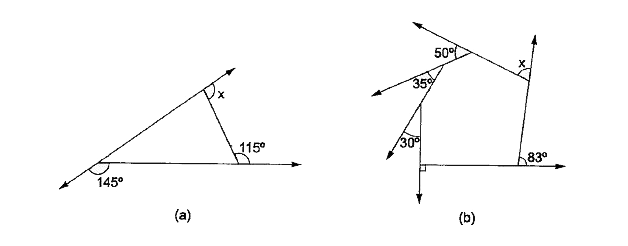
View Solutionनिम्नलिखित आकृतियों में x के मान ज्ञात कीजिए

View Solutionएक उत्तल चतुर्भुज के कितने विकर्ण होते हैं ?
View Solution2−3 का मान होगा:
View Solutionसमतल आकारों के कितने मापन होते है ?
View SolutionHow many lines of symmetry does the above figure have ?
View SolutionWhich of the following are correct chain isomers of butane ? (i)
View SolutionDetermine the point of symmetry of a regular hexagon.
View SolutionDtermine the images of the following figure about the given line :
View SolutionMatch the following Column A to Column B

View SolutionMatch the following Column A to Column B

View SolutionMatch the following Column A to Column B

View SolutionFind the area of the figure given below.

View SolutionThe area of the shaded part in the figure given below is ______.

View SolutionThe inequation represented by the graph given below is :
View SolutionThe inequation that best describes the graph given below is _________
View Solution
