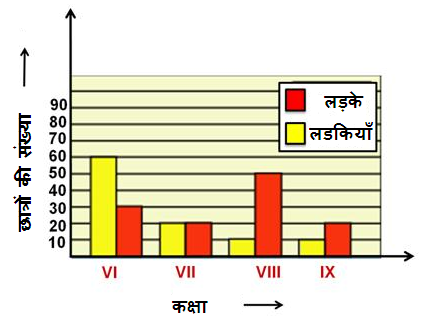
निम्न बार ग्राफ को ध्यान से समझकर दिए गए प्रश्न का उत्तर दें :

कक्षा VIII में लड़कों का लड़कियों से क्या अनुपात हैं ?
5:3
3:5
5:1
1:5
The correct Answer is:C
Step by step video & text solution for निम्न बार ग्राफ को ध्यान से समझकर दिए गए प्रश्न का उत्तर दें : कक्षा VIII में लड़कों का लड़कियों से क्या अनुपात हैं ? by Maths experts to help you in doubts & scoring excellent marks in Class 7 exams.
Updated on:21/07/2023समान प्रश्न
The area of the shaded part in the figure given below is ______.

View SolutionThe inequation represented by the graph given below is :
View SolutionThe inequation that best describes the graph given below is _________
View SolutionThe inequation that best describes the following graph is _________
View SolutionWhich inequations represent the shaded region in the given figure
View SolutionMatch the followings (column I with column II)
ltimg src="https://d10lpgp6xz60nq.cloudfront.net/physics_images/NCERT_BIO_XI_C03_E01_011_Q01.png" width="80%"gt
View SolutionMatch column I with column II:
ltimg src="https://d10lpgp6xz60nq.cloudfront.net/physics_images/NCERT_BIO_XI_C18_E01_003_Q01.png" width="80%"gt
View SolutionThe total surface area of the given solid figure is _______________.

View Solution
