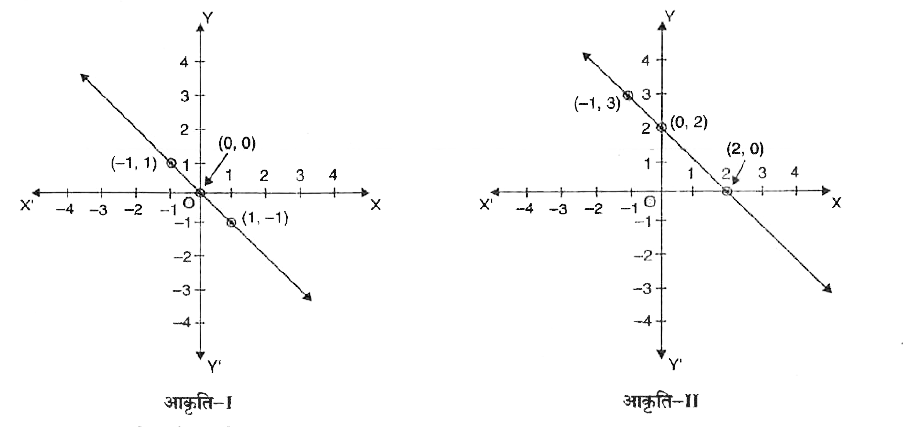
निम्नलिखित आलेखों में से प्रत्येक आलेख के लिए दिए गए विकल्पों से सही समीकरण का चयन कीजिए:

Step by step video & image solution for निम्नलिखित आलेखों में से प्रत्येक आलेख के लिए दिए गए विकल्पों से सही समीकरण का चयन कीजिए: by Maths experts to help you in doubts & scoring excellent marks in Class 9 exams.
Updated on:21/07/2023Topper's Solved these Questions
- दो चरों वाले रैखीय समीकरण BOOK - DEEPAK PUBLICATIONCHAPTER - दो चरों वाले रैखीय समीकरण EXERCISE - प्रश्नावली 4.4
4 Videos
- दो चरों वाले रैखीय समीकरण BOOK - DEEPAK PUBLICATIONCHAPTER - दो चरों वाले रैखीय समीकरण EXERCISE - परीक्षोपयोगी अन्य महत्त्वपूर्ण प्रश्न
7 Videos
- दो चरों वाले रैखीय समीकरण BOOK - DEEPAK PUBLICATIONCHAPTER - दो चरों वाले रैखीय समीकरण EXERCISE - प्रश्नावली 4.2
10 Videos
- त्रिभुजBOOK - DEEPAK PUBLICATIONCHAPTER - त्रिभुजEXERCISE - अध्याय का तीव्र अध्ययन
41 Videos
- निर्देशांक ज्यामिति BOOK - DEEPAK PUBLICATIONCHAPTER - निर्देशांक ज्यामिति EXERCISE - अध्याय का तीव्र अध्ययन
22 Videos
Similar Questions
(i) एक चर वाले
(ii) दो चर वाले
समीकरण के रूप में y=3 का ज्यामितीय निरूपण कीजिए |
View Solutionx = - 5 के दो चरों वाले समीकरण के रूप मे व्यक्त कीजिए ?
View Solutionनिम्नलिखित विकल्पों में कौन -सा विकल्प सत्य है, और क्यों ?
y=3x+5 का
(i) एक अद्वितीय हल है
(ii) केवल दो हल है
(iii) अपरिमित रूप से अनेक हल है।
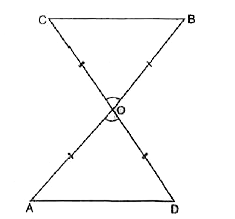
View Solutionआकृति में, OA = OB और OD = OC है, तो ΔAOD≅ΔBOC किस नियम पर आधारित है ?

View Solutionx-अक्ष से किसी बिंदु की दूरी को कहते हैं-
View SolutionHow many lines of symmetry does the above figure have ?
View SolutionWhich of the following are correct chain isomers of butane ? (i)
View SolutionDetermine the point of symmetry of a regular hexagon.
View SolutionDtermine the images of the following figure about the given line :
View SolutionMatch the following Column A to Column B

View SolutionMatch the following Column A to Column B

View SolutionMatch the following Column A to Column B

View SolutionThe inequation represented by the graph given below is :
View SolutionThe inequation that best describes the graph given below is _________
View SolutionThe inequation that best describes the following graph is _________
View SolutionWhich inequations represent the shaded region in the given figure
View Solution
