Plot the points (x, y) given in the following table on the plane, choosing suitable units of distance on the axes :
 Solution in Gujrati
Step by step video & image solution for Plot the points (x, y) given in the following table on the plane, choosing suitable units of distance on the axes : by Maths experts to help you in doubts & scoring excellent marks in Class 9 exams.
Updated on:21/07/2023Topper's Solved these Questions
- COORDINATE GEOMETRYBOOK - KUMAR PRAKASHANCHAPTER - COORDINATE GEOMETRYEXERCISE - SUMS TO ENRICH REMEMBER
11 Videos
- COORDINATE GEOMETRYBOOK - KUMAR PRAKASHANCHAPTER - COORDINATE GEOMETRYEXERCISE - MCQs
7 Videos
- COORDINATE GEOMETRYBOOK - KUMAR PRAKASHANCHAPTER - COORDINATE GEOMETRYEXERCISE - EXERCISE 3.3
2 Videos
- CONSTRUCTIONSBOOK - KUMAR PRAKASHANCHAPTER - CONSTRUCTIONSEXERCISE - Skill Testing Exercise
2 Videos
- HERON'S FORMULA BOOK - KUMAR PRAKASHANCHAPTER - HERON'S FORMULA EXERCISE - MULTIPLE CHOICE QUESTIONS
15 Videos
Similar Questions
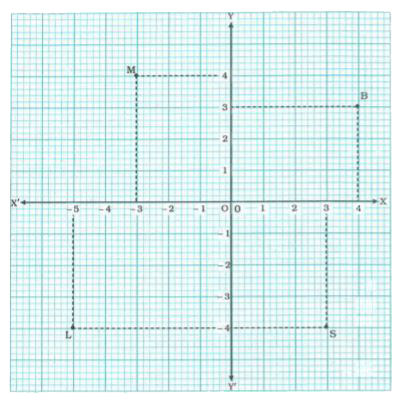
See the figure given below and complete the following statements :
The abscissa and the ordinate of the point B are……….and………respectively. Hence, the coordinates of B are (…………., ………….).

View SolutionAnswer each question by selecting the proper alternative from those given below each questions to make the statement true :
For x=2,y=3,u=−2 and v=−3, point (x+y,u+v) lies in the………quadrant.
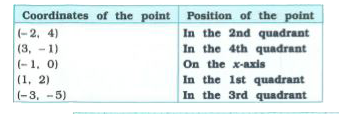
View SolutionIn which quadrant or on which axis does each of the points (−2,4),(3,−1),(−1,0),(1,2) and (−3,−5) lie ? Verify answer by locating them on the Cartesian plane.

View SolutionDraw an equilateral △PQR with perimeter 18cm. Write the steps of constrcutions.
View SolutionThe sides of a triangle m easure 8 cm, 12 cm and 6 cm. Then, the sem iperim eter of the triangle is ..........cm.
View SolutionWhich of the following are correct chain isomers of butane ? (i)
View SolutionDetermine the point of symmetry of a regular hexagon.
View SolutionDtermine the images of the following figure about the given line :
View SolutionMatch the following Column A to Column B

View SolutionMatch the following Column A to Column B

View SolutionMatch the following Column A to Column B

View SolutionFind the area of the figure given below.

View SolutionThe inequation represented by the graph given below is :
View SolutionThe inequation that best describes the graph given below is _________
View SolutionThe inequation that best describes the following graph is _________
View SolutionWhich inequations represent the shaded region in the given figure
View Solution
