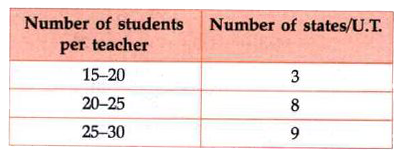
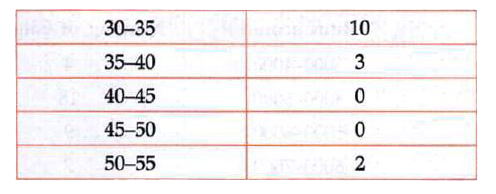
The following distribution gives the state wise teacher student ratio in higher secondary schools of India. Find the mode and mean of this data. Interpret the two measures .
Number of students per teacher Number of States /U.T. 15−20 3 20−25 8 25−30 9 30−35 10 35−40 3 40−45 0 45−50 0 50−55 2
The correct Answer is:30.6 and the mean of the given data is 29.2
Topper's Solved these Questions
- STATISTICSBOOK - KUMAR PRAKASHANCHAPTER - STATISTICSEXERCISE - Exercise 14.3
7 Videos
- STATISTICSBOOK - KUMAR PRAKASHANCHAPTER - STATISTICSEXERCISE - Exercise 14.4
1 Videos
- STATISTICSBOOK - KUMAR PRAKASHANCHAPTER - STATISTICSEXERCISE - Exercise 14.1
9 Videos
- SOME AAPLICATIONS OF TRIGONOMETRYBOOK - KUMAR PRAKASHANCHAPTER - SOME AAPLICATIONS OF TRIGONOMETRYEXERCISE - Objective Questions
24 Videos
- SURFACE AREAS AND VOLUMESBOOK - KUMAR PRAKASHANCHAPTER - SURFACE AREAS AND VOLUMESEXERCISE - TEST YOUR SKILLS
5 Videos
Similar Questions
The following distribution gives the state-wise teacher-student ratio in higher secondary schools of India. Find the mode and mean of this data. Interprent the two measures.


View SolutionThere are 20 teachers in a school of 500 students. The ratio of the number of teachers to the number of students is
View Solution
Knowledge Check
The mean of the following data is
{("Class interval",f),(" "10-15,5),(" "15-20,7),(" "20-25,3),(" "25-30,4),(" "30-35,8):}A22B23.05C24.05D27.05Find the approximate value of mean deviation about the mode of the following data.
{:("Class Interval",f),(" "0-10,4),(" "10-20,6),(" "20-30,3),(" "30-40,9),(" "40-50,5):}A11.5B12.5C13.5D14.5In a class of 40 students and 5 teachers, each student got sweets that are 15% of the total number of students and each teacher got sweets that are 20% of the total number of students.How many sweets were there?
A280B240C320D360
The mean weight of 20 students is 25 kg and the mean weight of another 10 students in 40 kg . Find the mean weight of the 30 students .
View SolutionThe scores in mathematics test (out of 25) of 15 students is as follows:
19, 25, 23, 20, 9, 20, 15, 10, 5, 16, 25, 20, 24, 12, 20
Find the mode and median of this data. Are they same?
View SolutionThe following table gives the marks obtained by some students.
Calculate the median marks obtained by the students.
Marks0−55−1010−1515−2020−2525−3030−3535−4040−45Number of Students 6 12 17 30 10 10 8 5 2
View SolutionThe scores in mathematics test (out of 25) of 15 students is as follows: 19, 25, 23, 20, 9, 20, 15, 10, 5, 16, 25, 20, 24, 12, 20 Find the mode and median of this data. Are they same?
View SolutionObtain the mean , median and mode of the following data :
Marks0−1010−2020−3030−4040−5050−6060−7070−80Number of Students 5 7 15 25 20 15 8 5
View Solution
