Find the mode of the following data :
Marks Number of students Below 10 8Below 20 20Below 30 45Below 40 58Below 50 70Solution in Gujrati
The correct Answer is:25.2 marks
Step by step video, text & image solution for Find the mode of the following data : {:("Marks ","Number of students "),("Below 10 "," "8),("Below 20 "," "20),("Below 30 "," "45),("Below 40 "," "58),("Below 50 "," "70):} by Maths experts to help you in doubts & scoring excellent marks in Class 10 exams.
Topper's Solved these Questions
- BOOK - KUMAR PRAKASHANCHAPTER - STATISTICSEXERCISE - Practice Thoroughly9videos
STATISTICS
- BOOK - KUMAR PRAKASHANCHAPTER - STATISTICSEXERCISE - Objective Questions (Fill in the blanks)5videos
STATISTICS
- BOOK - KUMAR PRAKASHANCHAPTER - STATISTICSEXERCISE - Exercise 14.41videos
STATISTICS
- BOOK - KUMAR PRAKASHANCHAPTER - SOME AAPLICATIONS OF TRIGONOMETRYEXERCISE - Objective Questions24videos
SOME AAPLICATIONS OF TRIGONOMETRY
- BOOK - KUMAR PRAKASHANCHAPTER - SURFACE AREAS AND VOLUMESEXERCISE - TEST YOUR SKILLS5videos
SURFACE AREAS AND VOLUMES
Similar Questions
Heights (in cm) of girls of Class X of a school are recorded as under .
Height (in cm) No. of girls Less than 140 3Less than 145 10Less than 150 31Less than 155 38Less than 160 50
Make continuous frequency distribution for the above data02:57View SolutionIf the mean of 6, 7, x, 8, y, 14 is 9,then x + y = . . . .
02:33View SolutionDuring the medical check-up of 35 students of a class. their weights were recorded as follows :
weight (in kg) Number of students Less than 38 0Less than 40 3Less than 42 5Less than 44 9Less than 46 14Less than 48 28Less than 50 32Less than 52 35
Draw a less than type ogive for the given data. Hence obtain the median weight from the graph and verify the result by using the formula02:14View SolutionA kite is flying at a height of 75m from the level ground, attached to a taut string inclined at 60∘ to the horizontal. Then, the length of the string is …………m
01:40View SolutionThe slant height of a frustum of a cone is 4 m and the perimeter of circular ends are 18 m and 16 m. Find the cost of painting its curved surface at 10 per sq. m.
10:16View SolutionFind the mode of the following distribution of marks obtained by 80 students: Marks obtained 0-10 10-20 20-30 30-40 40-50 No. of students 6 10 12 32 20
02:56View SolutionCalculate the median from the following data: Marks below: 10 20 30 40 50 60 70 80 No. of students: 15 35 60 84 96 127 198 250
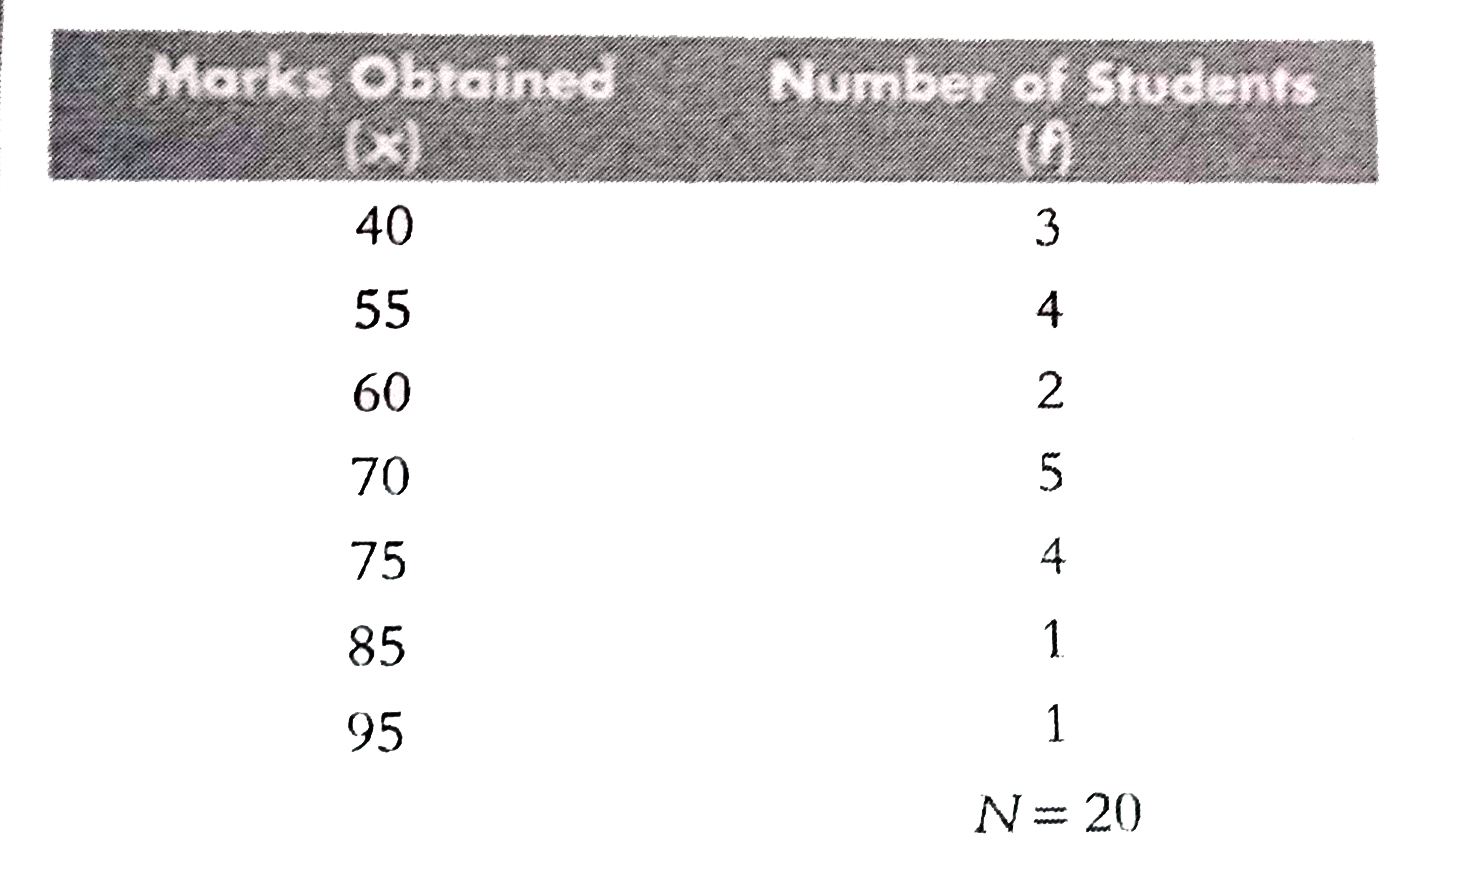
04:24View SolutionThe marks (maximum marks 100) obtained by 20 students in a test are given below :

Find the mean marks of the 20 students.03:27View Solutionनिम्न प्रेक्षण 18 छात्रों के गणित की परीक्षा में प्राप्तांकों को दर्शाते है, इनका माध्य ज्ञात कीजिए -
45, 40, 50, 40, 60, 40, 50, 50, 70, 30, 20, 70, 50, 45, 30, 20, 70, 7004:13View SolutionFind the mean, median, and mode of marks obtained by 20 students in an examination. The marks are given below.
 03:26View Solution
The mean deviation from the mean of the data given below is:
Marks 10 15 20 25 30
No. of Students 2 4 6 8 506:03View SolutionA life insurance agent found the following data for distribution of ages of 100 policy holders. Calculate the median age, if policies are given only to persons having age 18 years onwards but less than 60 years.
Age (in years)Number of policy holdersAge (in years)Number of policy holdersBelow 20 2Below 45 89Below 25 6Below 50 92Below 30 24Below 55 98Below 35 45Below 60 100Below 40 7804:45View SolutionFind the mode of the following distribution of marks obtained by 80 students: Marks obtained 0-10 10-20 20-30 30-40 40-50 No. of students 6 10 12 32 20
03:55View SolutionThe following table gives the marks scored by 100 students in an entrance examination. Marks: 0-10 10-20 20-30 30-40 40-50 50-60 60-70 70-80 No. of Students (Frequency): 4 10 16 22 20 18 8 2 Represent this data in the form of a histogram.
04:19View SolutionFind the mode of the following distribution of marks obtained by 80 students: Marks obtained 0-10 10-20 20-30 30-40 40-50 No. of students 6 10 12 32 20
04:30View SolutionFind the mean marks of the students from the following cumulative frequency distribution: Marks: Below Below Below Below Below Below Below Below Below Below 10 20 30 40 50 60 70 80 90 100 No. of Students 5 9 17 29 45 60 70 78 83 85
02:06View Solution

