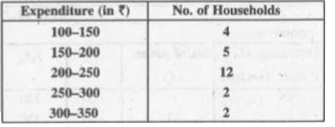
The table below shows the daily expenditure on food of 25 households in a locality :

Find the mean daily expenditure on food by the step-deviation method.Solution in Gujrati
Step by step video & image solution for The table below shows the daily expenditure on food of 25 households in a locality : Find the mean daily expenditure on food by the step-deviation method. by Maths experts to help you in doubts & scoring excellent marks in Class 10 exams.
Updated on:21/07/2023Topper's Solved these Questions
- QUESTION PAPER -1Book:KUMAR PRAKASHANChapter:QUESTION PAPER -1Exercise:SECTION D ( Answer the following as required with calculations)
Explore 1 Video
- QUESTION PAPER -1Book:KUMAR PRAKASHANChapter:QUESTION PAPER -1Exercise:SECTION B( Answer the following briefly with calculations )
Explore 14 Videos
- QUADRATIC EQUATIONSBook:KUMAR PRAKASHANChapter:QUADRATIC EQUATIONSExercise:Test Your Skills
Explore 19 Videos
- QUESTION PAPER-2Book:KUMAR PRAKASHANChapter:QUESTION PAPER-2Exercise:Section C
Explore 14 Videos
Similar Questions
Draw a line segment of length 6.5 cm and divide it in the ratio 3:4. Measure the two parts and write the steps of construction.
View SolutionProve that 3+√2 is an irrational number.
View SolutionCheck whether the following are quadratic equations :
(1) (x−3)2=x(2x−5)
(2) (2x−3)(8x+1)=(4x+5)(4x−5)
(3) (5x+3)(x−2)=(4x+3)(2x−1)
(4) (2x+5)3=8(x−1)3
(5) x2+7x−8=x(x+5)
(6) x3+9x2−7x+2=(x+3)3
View SolutionOn dividing x3−3x2+x+2 by a polynomial g(x)=x2−x+1, then quotient and remainder.
View SolutionThe table below shows the daily expenditure on food of 25 households in a locality.Find the mean daily expenditure on food by a suitable method.
View SolutionThe table below shows the daily expenditure on food of 30 households in a locality:

Find the mean and median daily expenditure on food.
View SolutionDetermine the point of symmetry of a regular hexagon.
View SolutionMatch the following Column A to Column B

View SolutionThe inequation represented by the graph given below is :
View SolutionThe inequation that best describes the graph given below is _________
View Solutionनिम्नलिखित सारणी किसी मोहल्ले के 25 परिवारों में भोजन पर हुए दैनिक व्यय को दर्शाती है: एक उपयुक्त विधि द्वारा भोजन पर हुआ माध्य व्यय ज्ञात कीजिए।

View Solutionनिम्नलिखित सारणी किसी मोहल्ले के परिवारों में भोजन पर हुए दैनिक व्यय को दर्शाती है :
एक उपयुक्त विधि द्वारा भोजन पर हुआ माध्य व्यय ज्ञात कीजिए ।

View SolutionThe table below shows the daily expenditure on food of 25 households in a locality .
Daily expenditure (Rs)Number of households100−1504150−2005200−25012250−3002300−3502 Find the mean of expenditure on food of households in a locality .
View SolutionThe table below shows the daily expenditure on food of 25 households in a locality.

Find the mean daily expenditure on food by a suitable method.
View SolutionThe table below shows daily expenditure on food of 25 households in a locality.
Find the mean daily expenditure.

View SolutionThe table below shows the daily expenditure on food of 25 households in a locality.
Dail expenditure (in Rs)100−150150−200200−250250−300300−350Number of households451222
Find the mean daily expenditure on food by suitable method.
View Solution