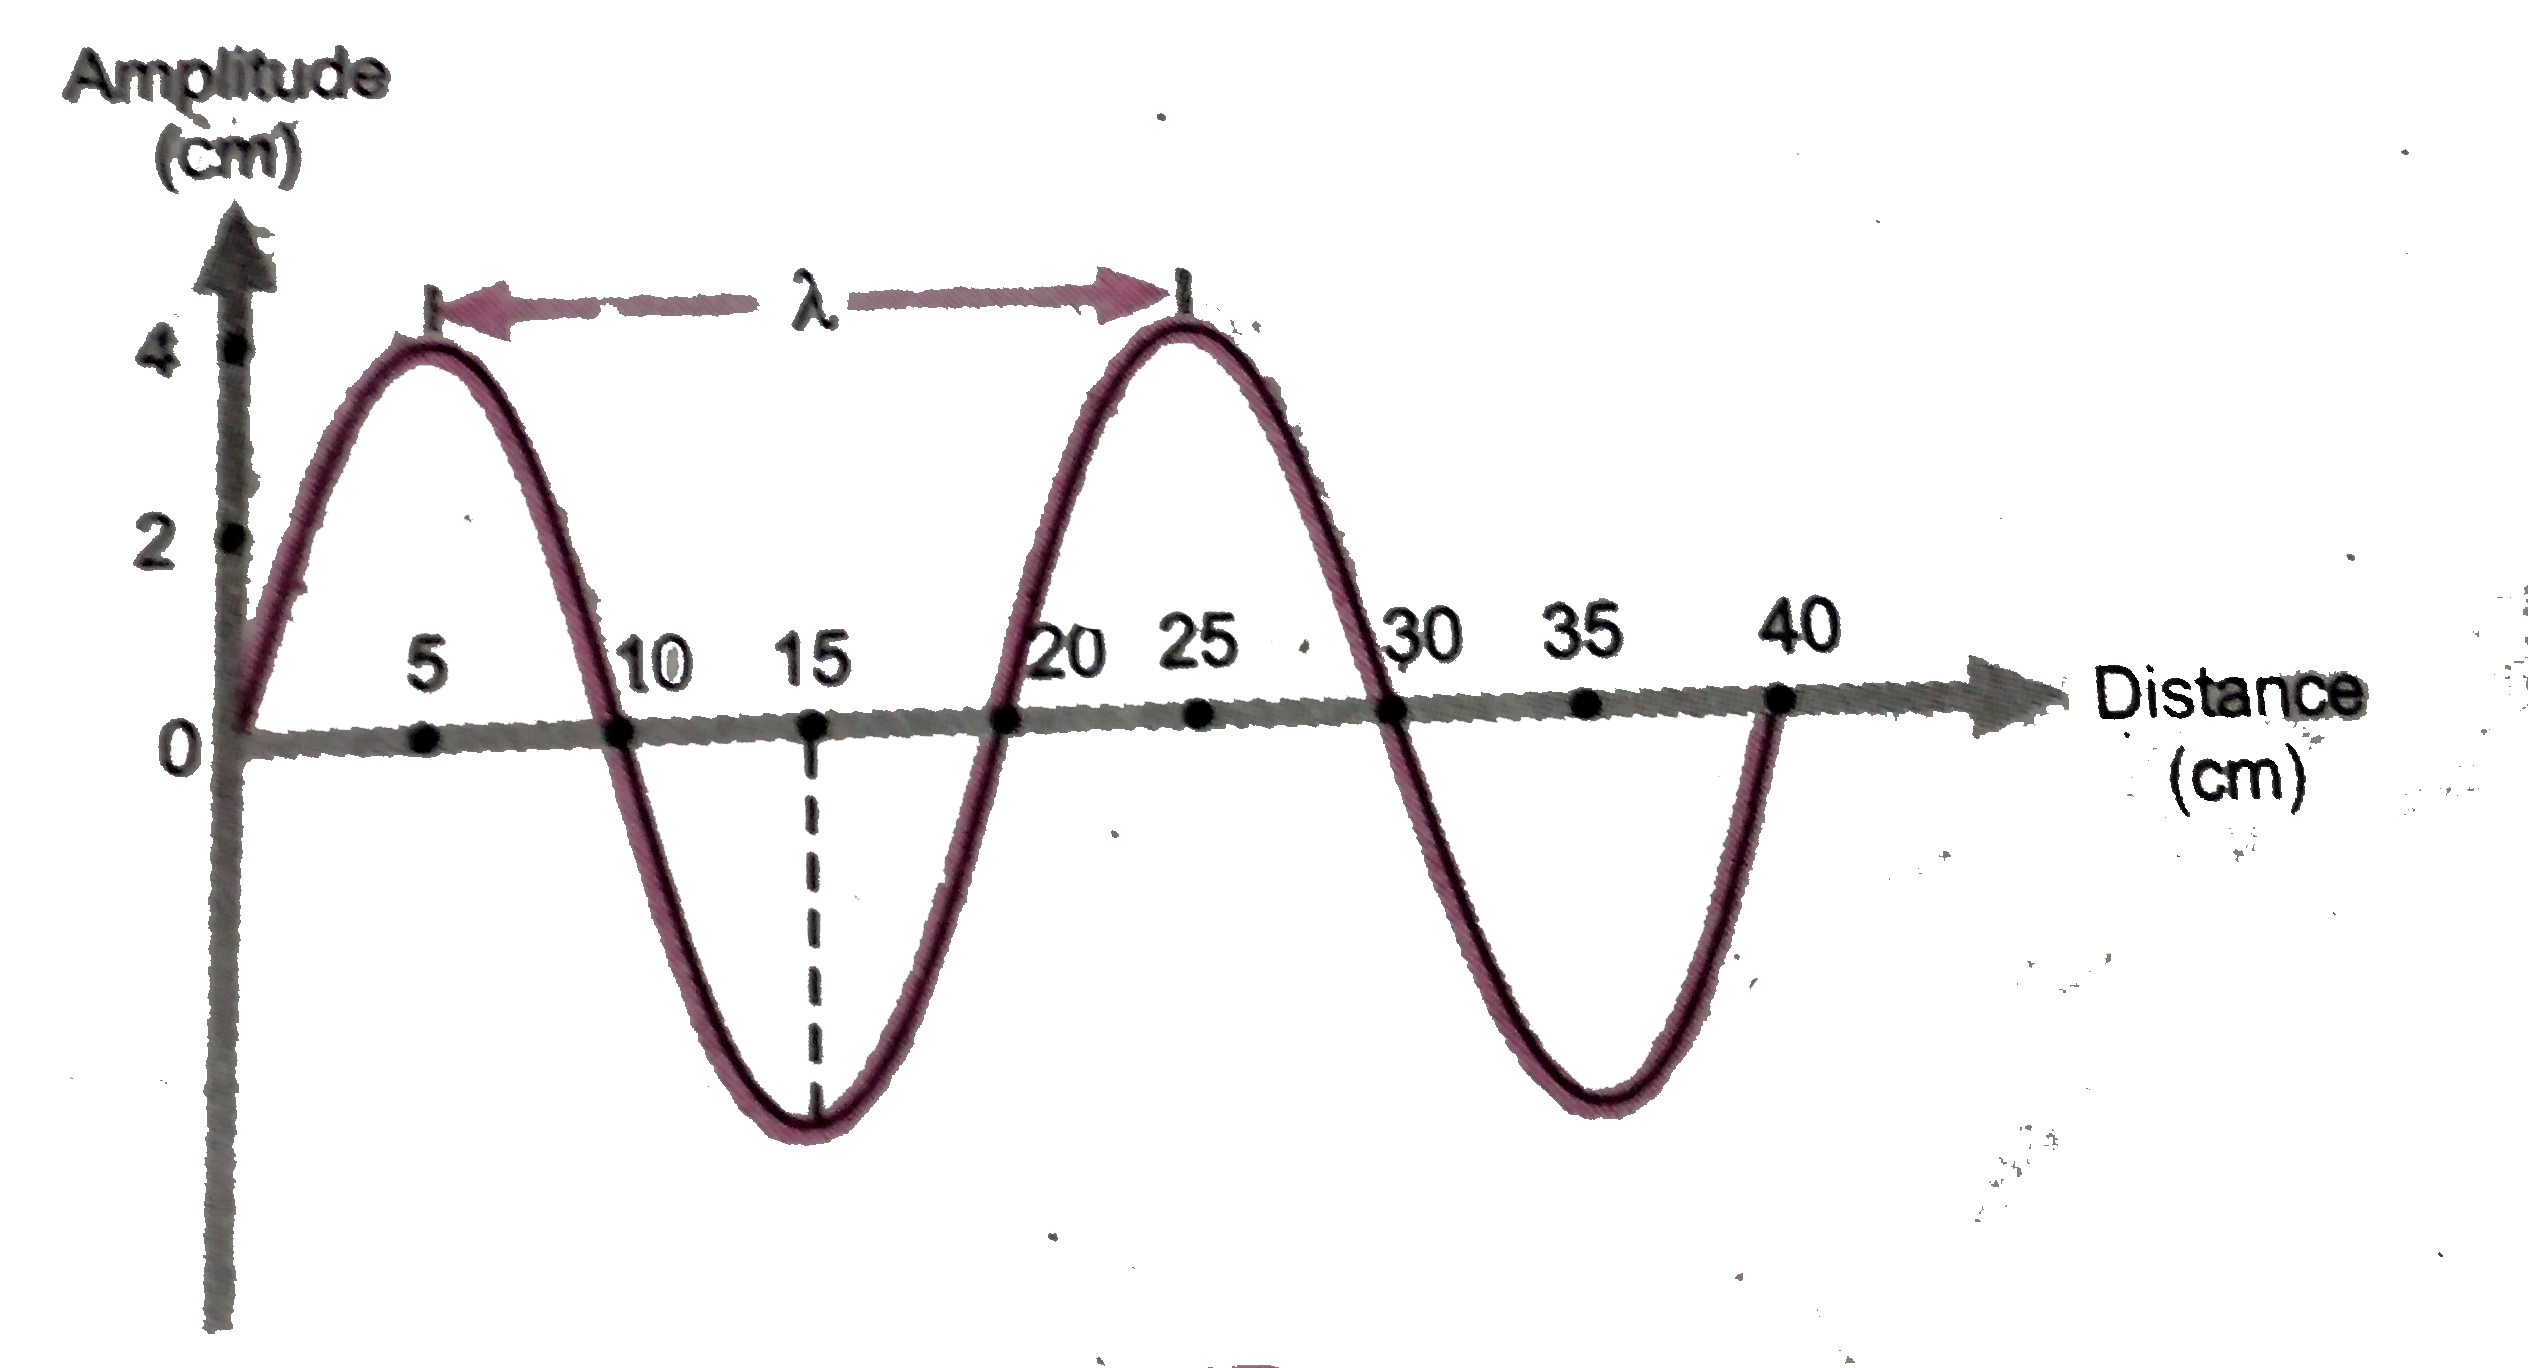
The following figure shows a wave form of frequency 50 Hz:

(i)amplitude (ii)Wavelength (iii)velocity (iv)time period
Text Solution
(i)Amplitude (A) = 4 cm
(ii)Wavelength (λ)=20cm=20×10−2m
(iii)Velocity v=vλ=50×20×10−2=10ms−1
(∵ v=frequency=50 Hz)
(iv) Time period T=λv=20×10−210=0.02s
|
Topper's Solved these Questions
- SOUNDBOOK - KUMAR PRAKASHANCHAPTER - SOUNDEXERCISE - QUESTIONS AND ANSWERS ( Give scientific reason for the following statements:)
5 Videos
- SOUNDBOOK - KUMAR PRAKASHANCHAPTER - SOUNDEXERCISE - QUESTIONS AND ANSWERS ( Match the following property :)
4 Videos
- SOUNDBOOK - KUMAR PRAKASHANCHAPTER - SOUNDEXERCISE - QUESTIONS AND ANSWERS (State whether the following statements are true or false:)
15 Videos
- QUESTION PAPER 03BOOK - KUMAR PRAKASHANCHAPTER - QUESTION PAPER 03EXERCISE - SECTION -D
3 Videos
- WORK AND ENERGY BOOK - KUMAR PRAKASHANCHAPTER - WORK AND ENERGY EXERCISE - QUESTION & ANSWER (ADDITIONAL NUMERICALS FOR PRACTICE)
50 Videos
Similar Questions
Knowledge Check
A listener is at rest with respect to the source of sound. A wind starts blowing along the line joining the source and the observer. Which of the following quantities do not change?
(i) Frequency
(ii) Velocity of sound
(iii) Wavelength
(iv) Time periodA(i),(iv)B(iv),(ii)C(iii),(iv)D(ii),(iv)Find the time period of a wave whose frequency is 400Hz.
A0.025 sB0.00025 sC0.0025 sD0.25 sAn electrically maintained tuning fork vibrates with constant frequency and constant amplitude. If the temperature of the surrounding air increases but pressure remains constant, the sound produced will have
(i) larger wavelength
(ii) larger frequency
(iii) larger velocity
(iv) larger time periodA(i),(iv)B(i),(iii)C(iii),(iv)D(ii),(iv)
shows a snapshot of a wave-form of frequency 50Hz. For this wave motion, find
(a) wavelength
(b) amplitude
( c) velocity.
 .
.
View Solutionshows a snapshot of a wave-form of frequency 50Hz. For this wave motion, find
(a) wavelength
(b) amplitude
( c) velocity.
 .
.
View SolutionFind the time period of a wave whose frequency is 400Hz.
View SolutionClassify the following as scalar and vector quantities. (i) time period (ii) distance (iii) force (iv) velocity (v) work done
View SolutionClassify the following as scalar and vector quantities. (i) time period (ii) distance (iii) force (iv) velocity (v) work done
View Solution
