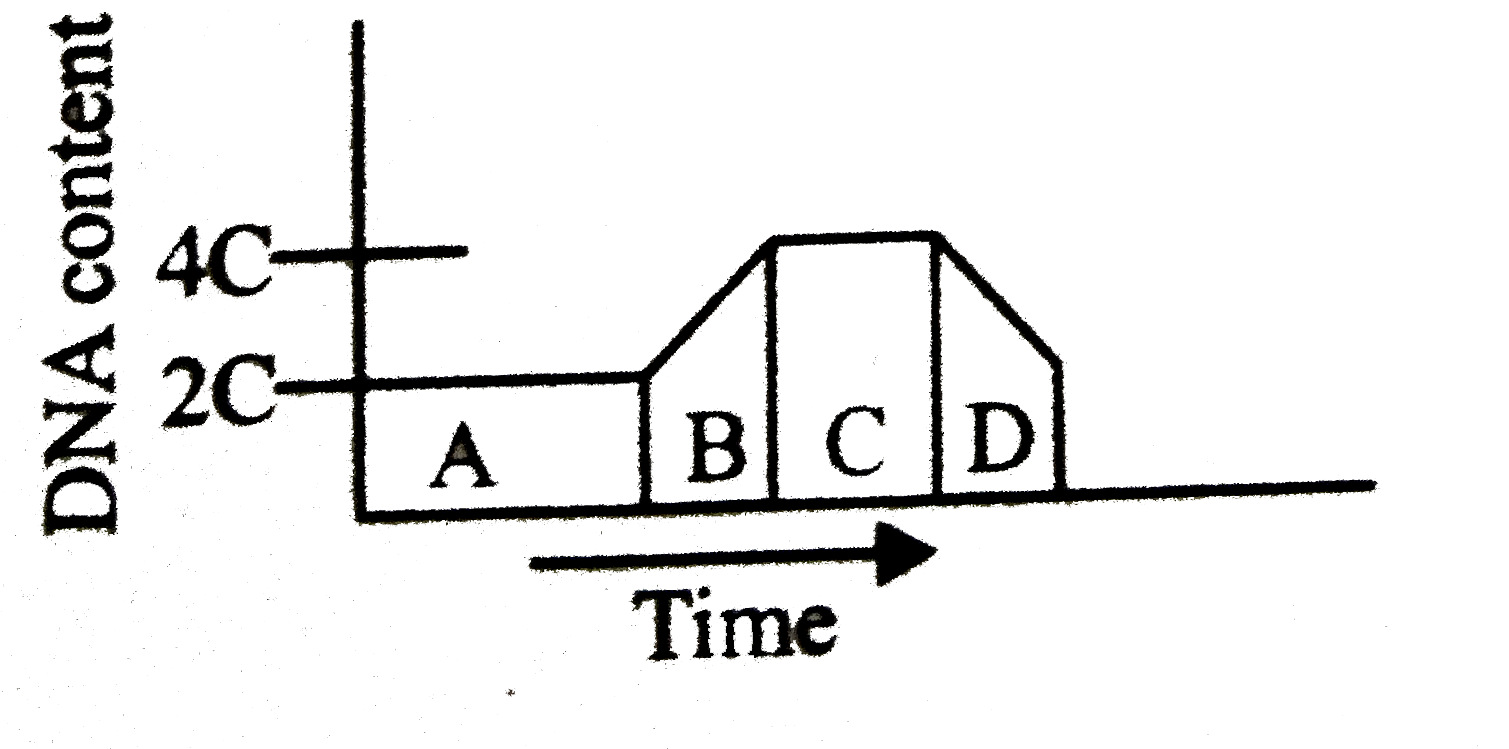
The above graph shows the change In DNA content during various phases (A to (d) in a typical mitotic cell cycle. Identify the phases

The correct Answer is:C
Similar Questions
Knowledge Check
The given graph shows the change in DNA content during various phases (A to D) in a typical mitotic cell cycle. Identify the phases and select the correct option.
 AABCDG2G1SMBABCDG2SG1MCABCDG1SG2MDABCDMG1SG2
The given graph shows the change in DNA content during various phases (A to D) in a typical mitotic cell cycle. Identify the phases and select the correct option.
 AABCDG2G1SMBABCDG2SG1MCABCDG1SG2MDABCDMG1SG2
In G2-phase, DNA content is
A2nBnC3nD4n
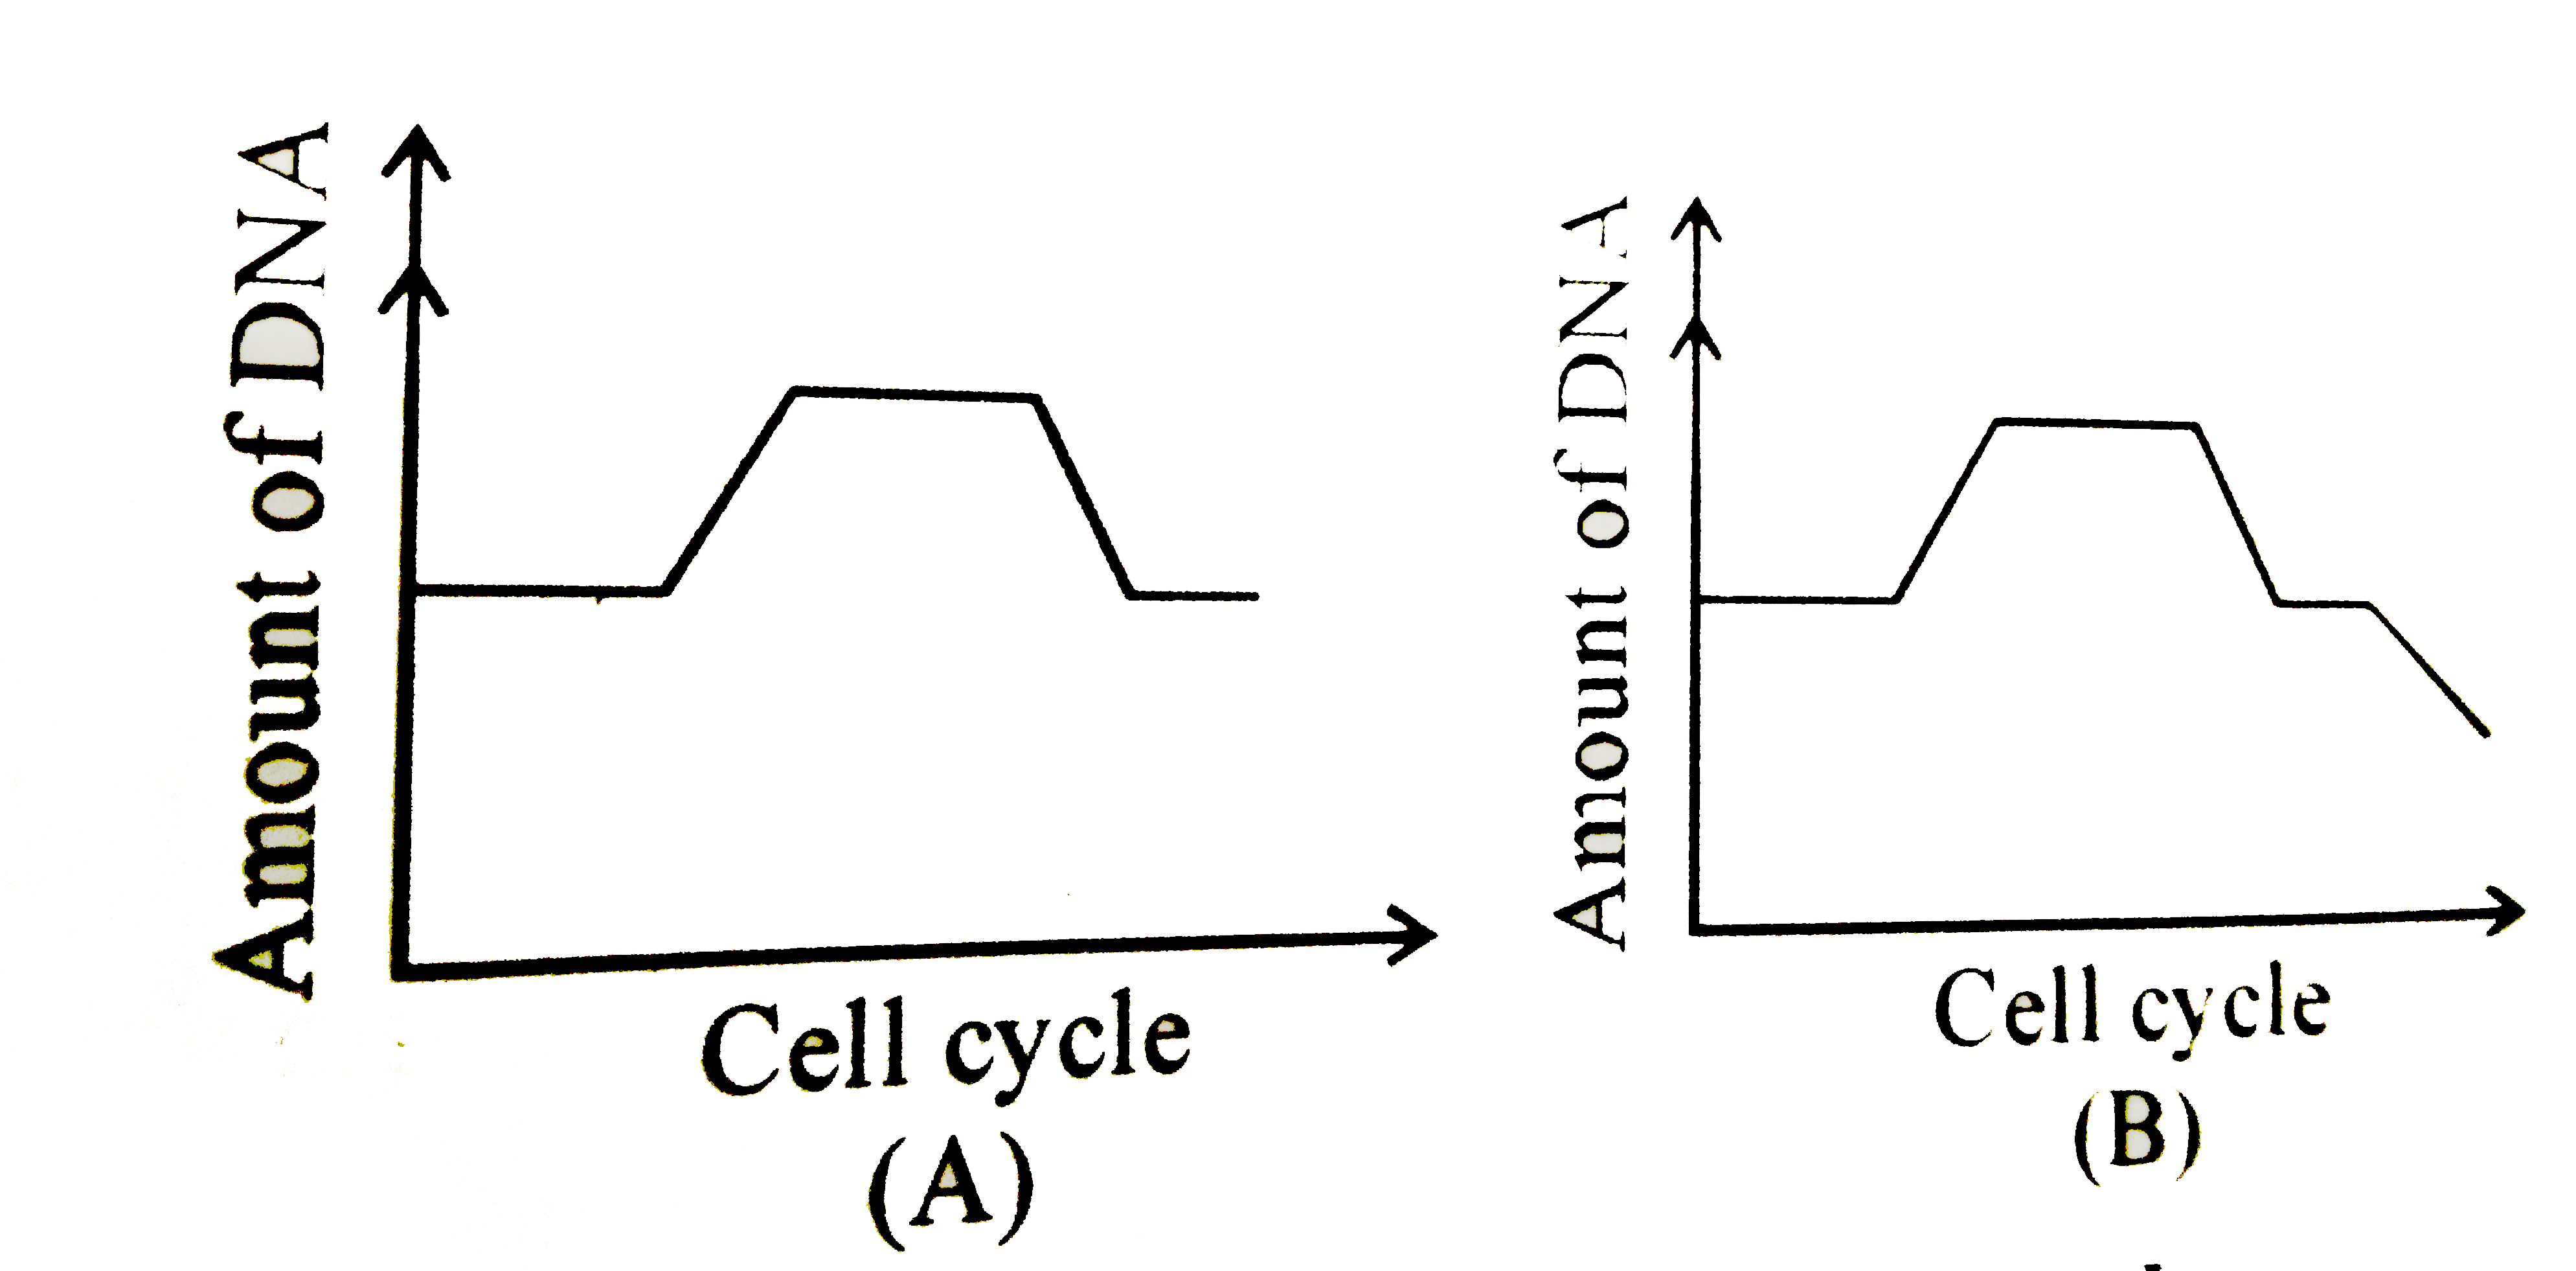
The following graphs (A and B) depicts changes in DNA Content during cell cycle. Identify the cell divison from A and B :-

View SolutionWhat are the changes occurring during ana phase of mitotic cell division?
View SolutionThe DNA content of individual cells and the number of cells in each phase of a "cell cycle" can be determined using flow cytometry. Which of the following combinations of "phase of a cell cycle and its corresponding DNA content" can be considered normal?
A. Diploid cells found In the G0 or G1 phase.
B. Cells with twice the normal DNA content in the early M phase.
C. Cells with intermediate amounts of DNA In the S phase.
D. Cells with twice the normal DNA content in the G2 phase.
View SolutionIn a mitotic cycle,the correct sequence of phases is
View SolutionIn a mitotic cycle,the correct sequence of phases is
View Solution
