The graph below illustrates the behaviour of the chromosomes during one mitotic cell division.
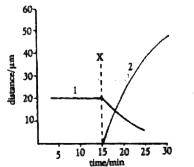
Which one of the following correctly indicates the changes illustrated by curves 1 and 2, and the stage of mitosis which is commencing at X?.

Text Solution
The correct Answer is:A
|
Similar Questions
Knowledge Check
Which one of the following graphs correctly gives the ideal gas behaviour ?
A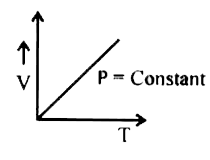 B
B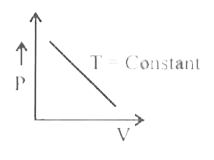 C
C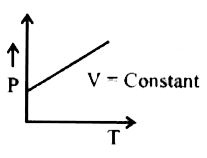 D
D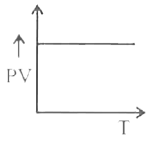
Which one of the following sketches does not illustrate budding in yeast?
 AIBIICIIIDIV
Given below is a schematic break-up of the phases/stages of cell cycle. Which one of the following is the correct indication of the stage/phase in the cell cycle?
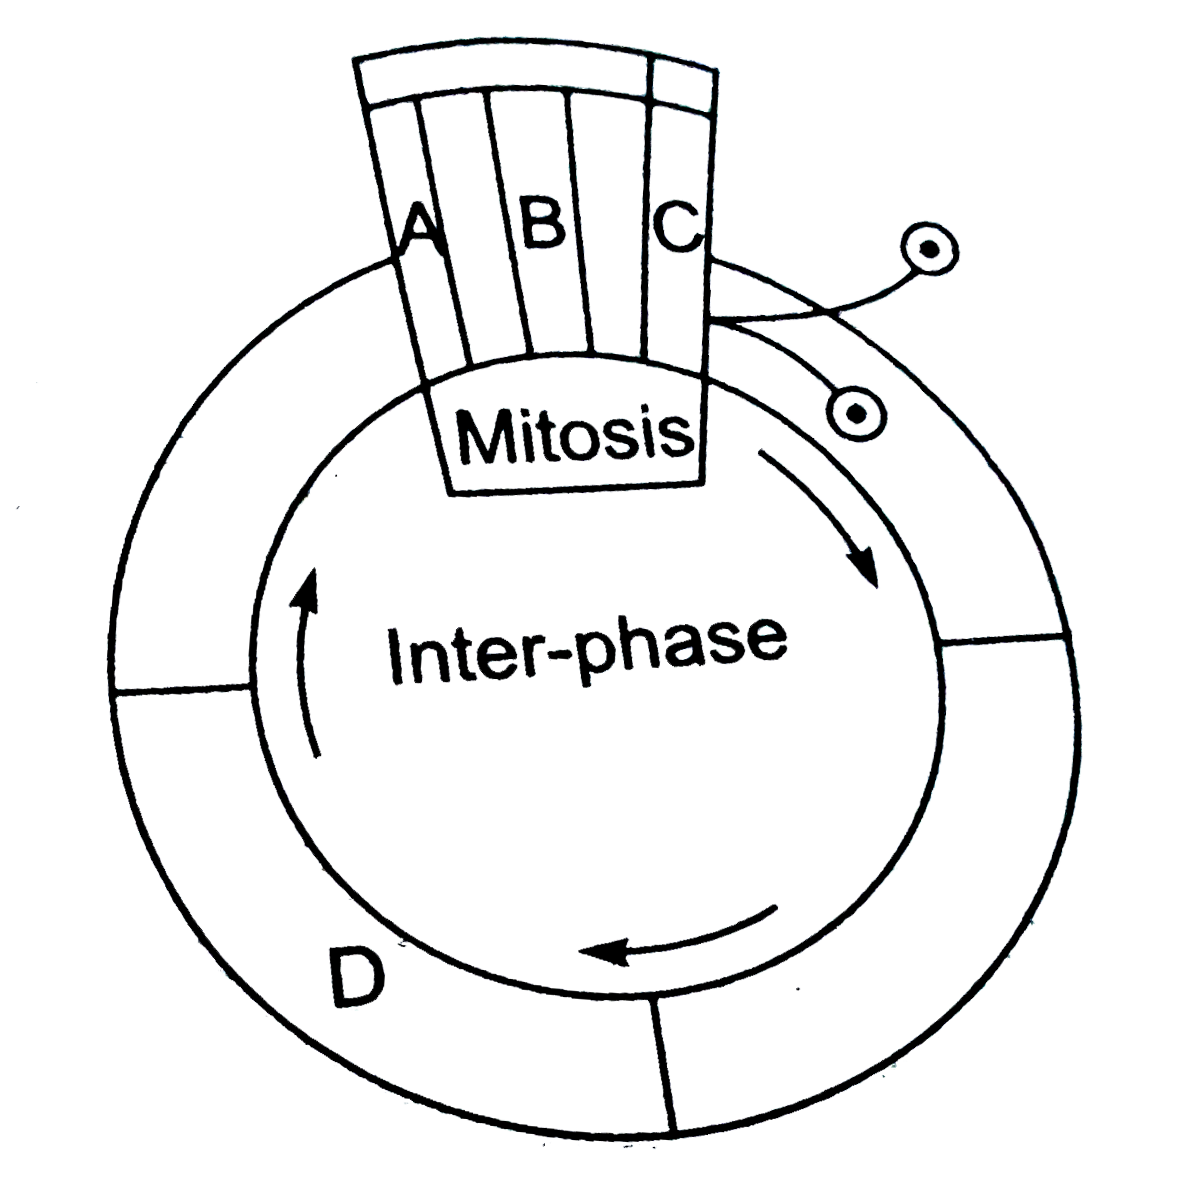 AA-cytokinesisBB-ProphaseCC-KaryokinesisDD-synthetic phase
In Illustration 6, which one of the following statement is correct ?
View SolutionIn Illustration 6, which one of the following statement is correct ?
View SolutionGiven below is a schematic break-up of the phases/stages of cell cycle :-
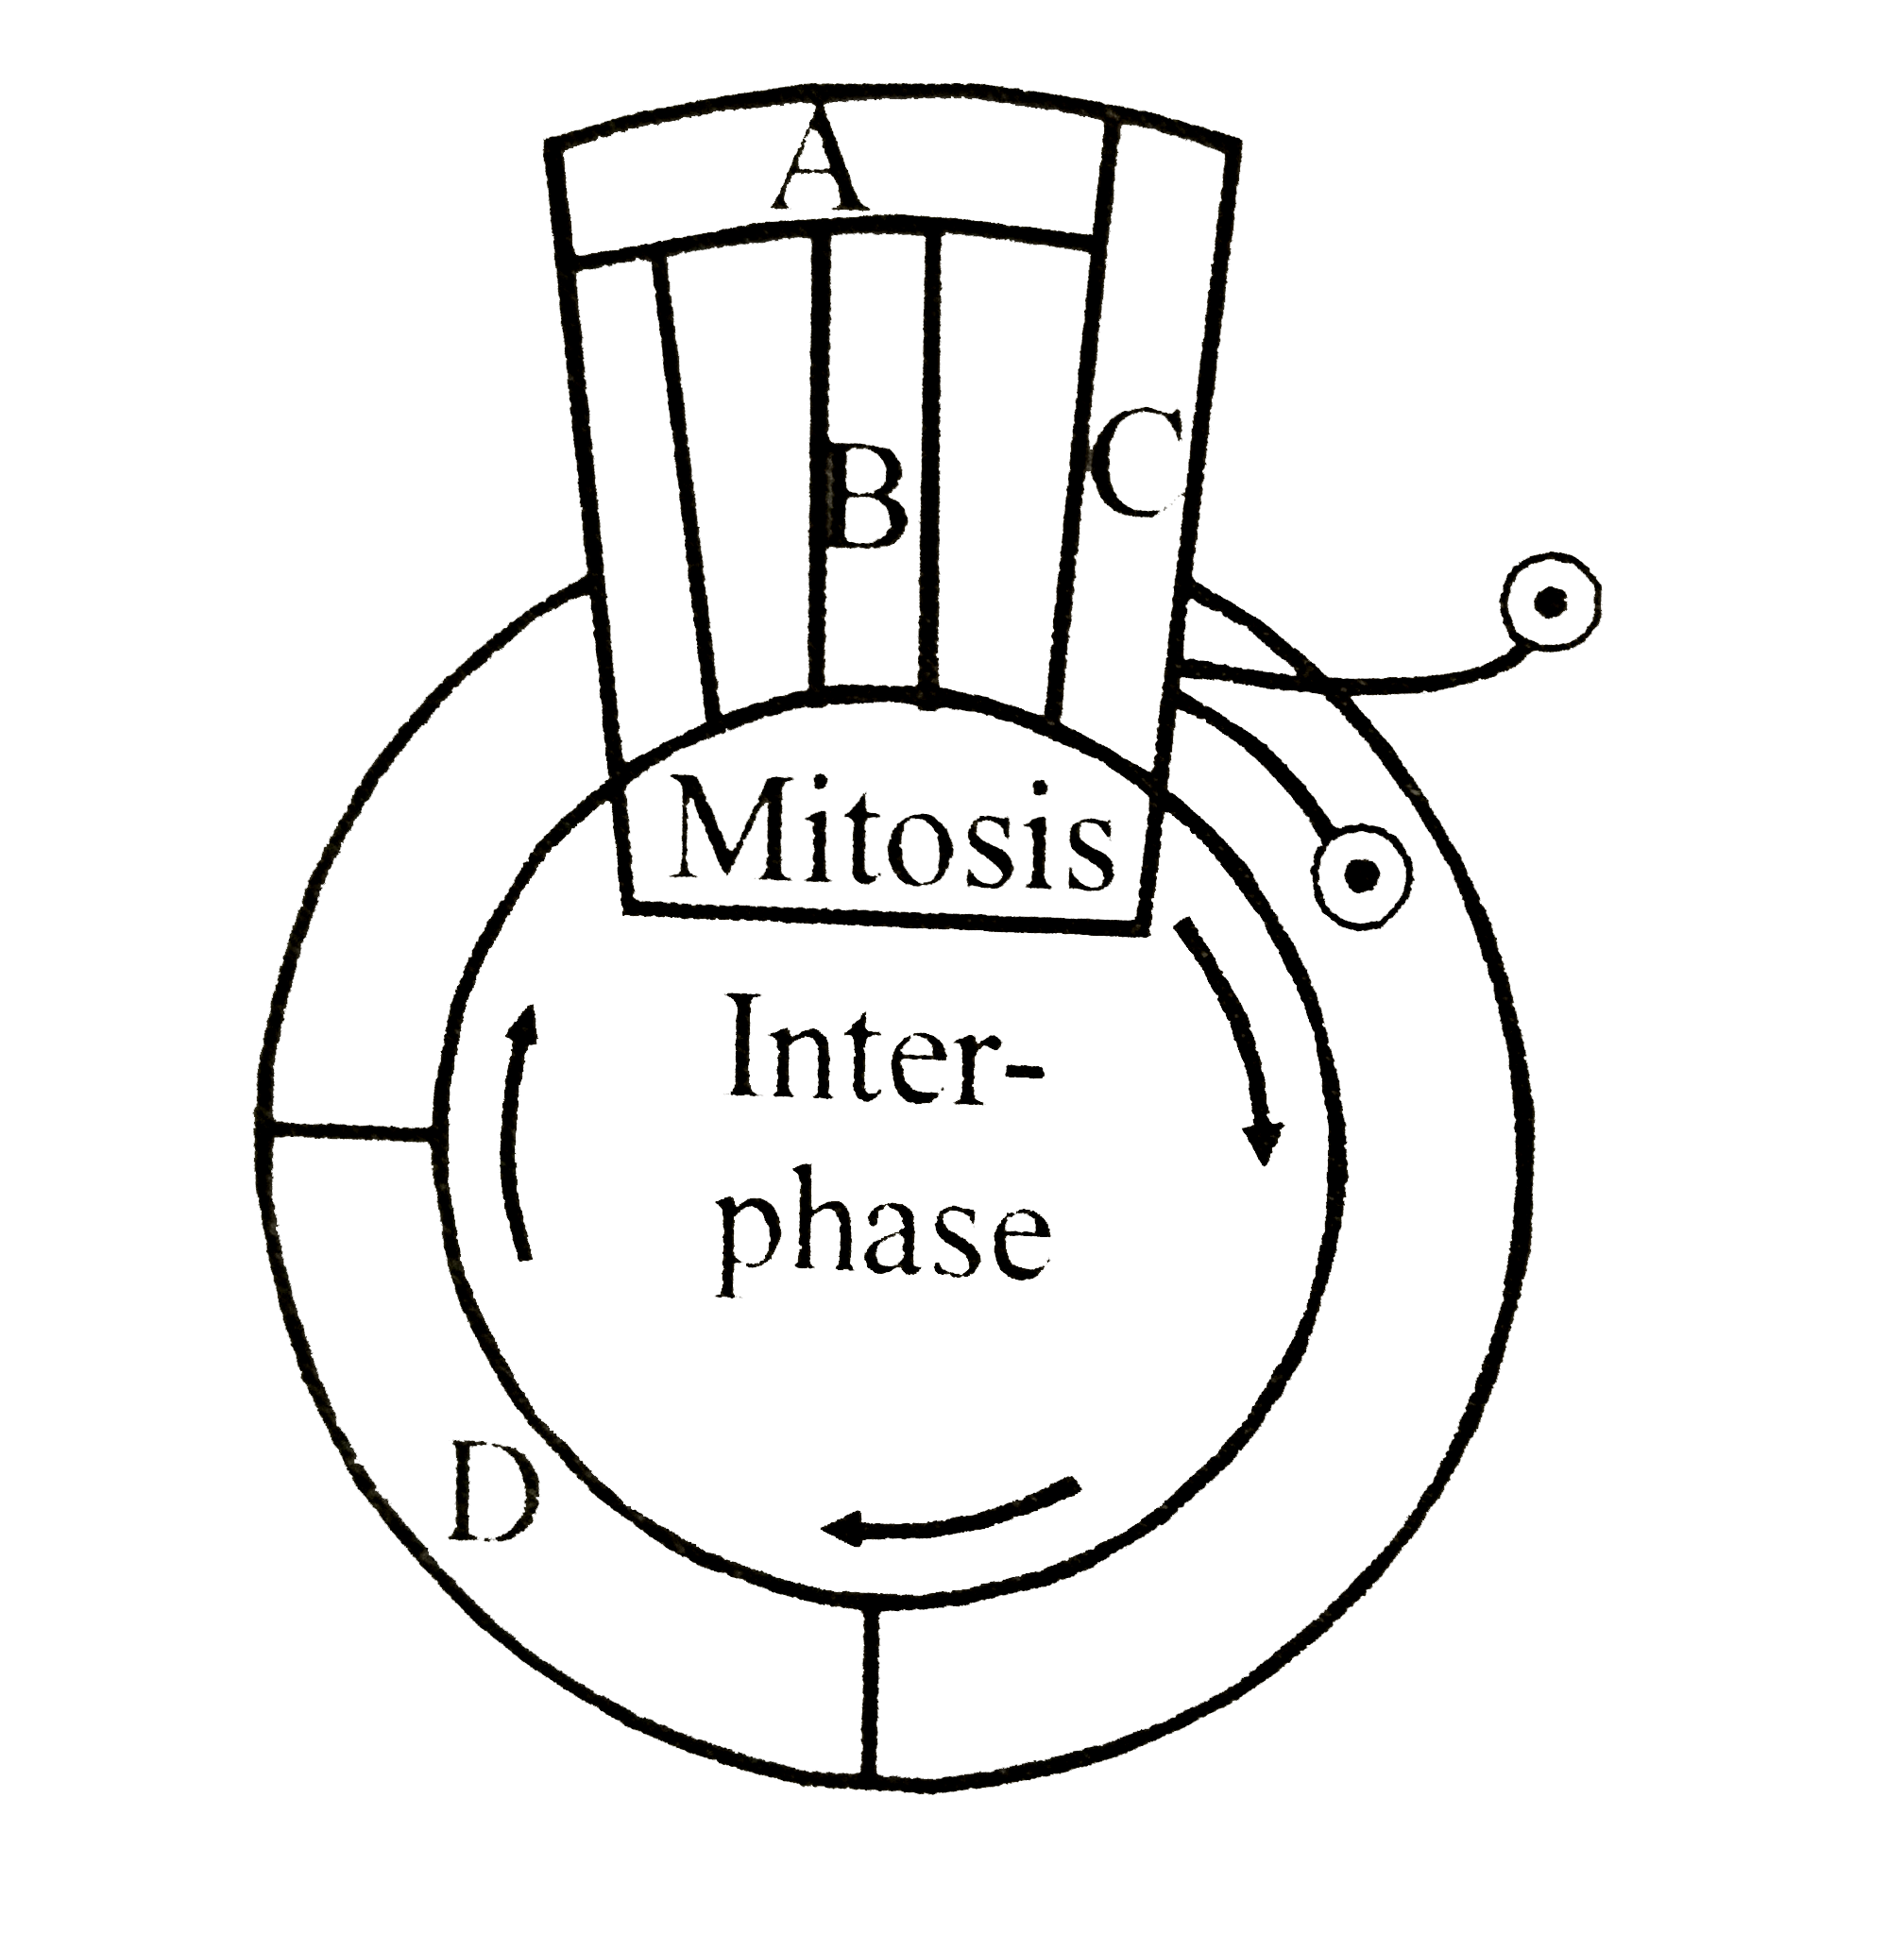
Which one of the following is the correct indication of the stage/phase in the cell cycle?
View SolutionGiven below is a schematic break-up of the phases/stages of cell cycle :-

Which one of the following is the correct indication of the stage/phase in the cell cycle?
View SolutionGiven below is a schematic break-up of the phases/stages of cell cycle. Which one of the following is the correct indication of the stage/phase in the cell cycle?

View Solution

