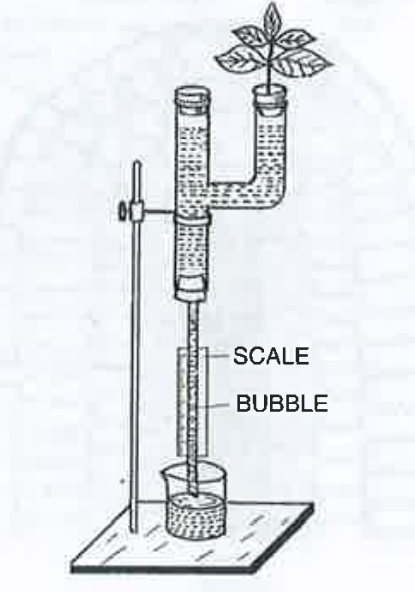
Go through the experiment shown in the following diagram -
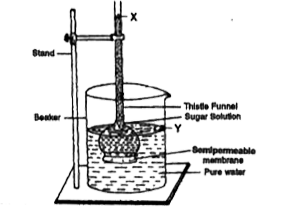
After a few days, which of the following will have occurred?
A
A rise in level X and a drop in level Y
B
A drop in level X and a drop in level Y
C
A rise in level X and a rise in level Y
D
A drop in level X and a rise in level Y
Text Solution
The correct Answer is:A
|
Similar Questions
Knowledge Check
Observe the following experiment
After a few days, which of the following changes will have occurred AA drop in level X and a rise in level YBA rise in level X and a rise in level YCA drop in level X and a drop in level YDA rise in level X and a drop in level Y
Go through the experiment shown in the following diagram

After two weeks the appearance of the shoot would beA B
B C
C D
D
Observe the following figure
After the system reaches equilibrium, Which of the following changes will have occurred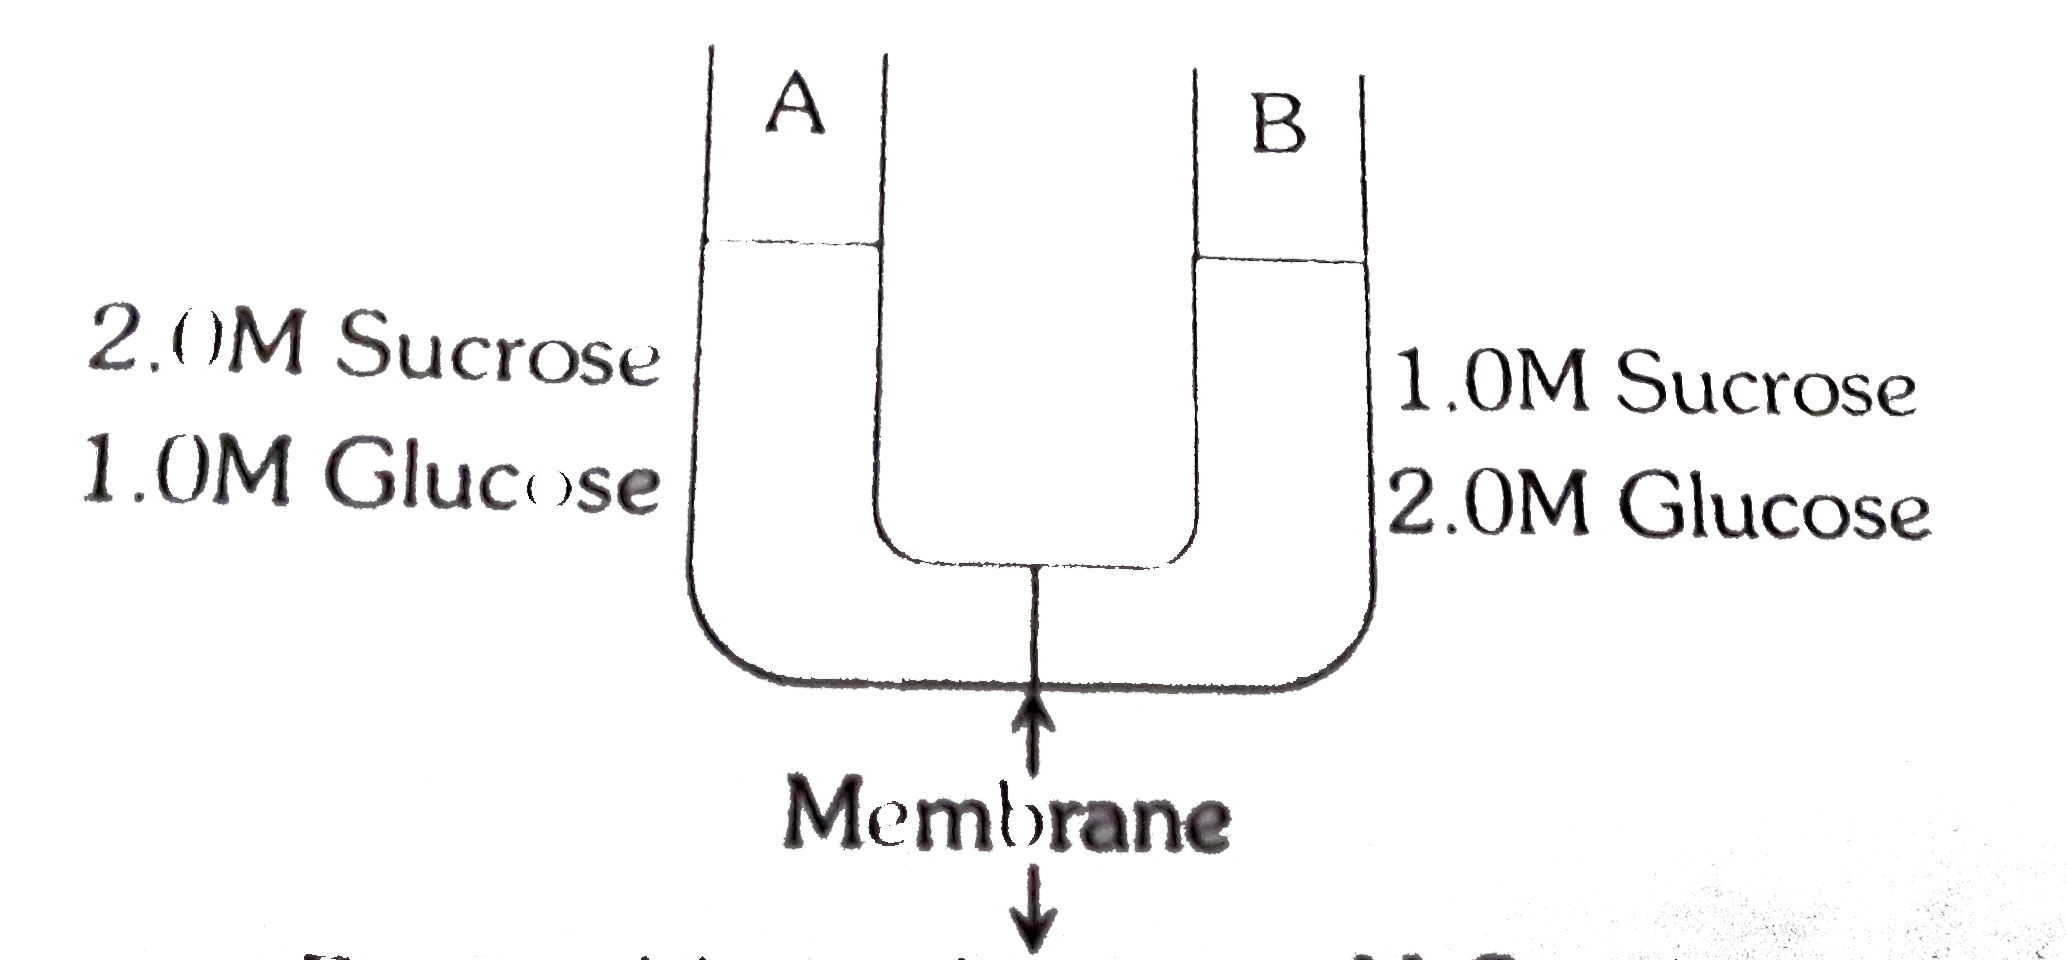 AFirst the level of water is hgih in tube A and than water level is decreasedBNo change is observedCThe water level is higher in side B than in side ADThe water level is higher in side A than in side B
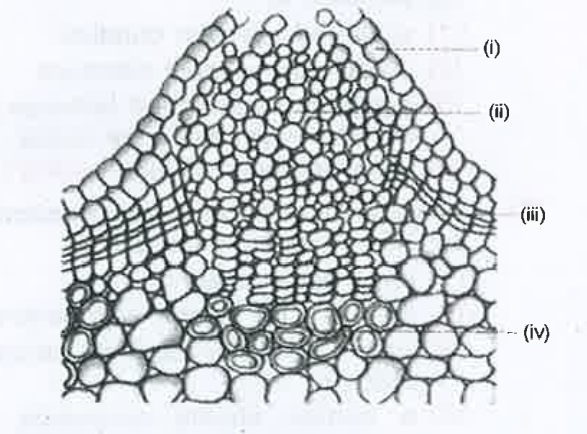
Go through the following diagram carefully which of the following represents the correct labelling ?
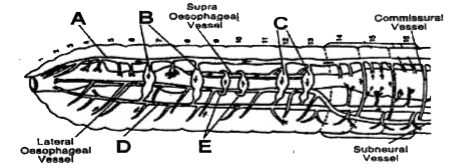
View SolutionGo through the blood vascular system of earthworm given in the following diagram

View SolutionGiven figure represents demonstration of osmosis by egg membrane osmoscope.
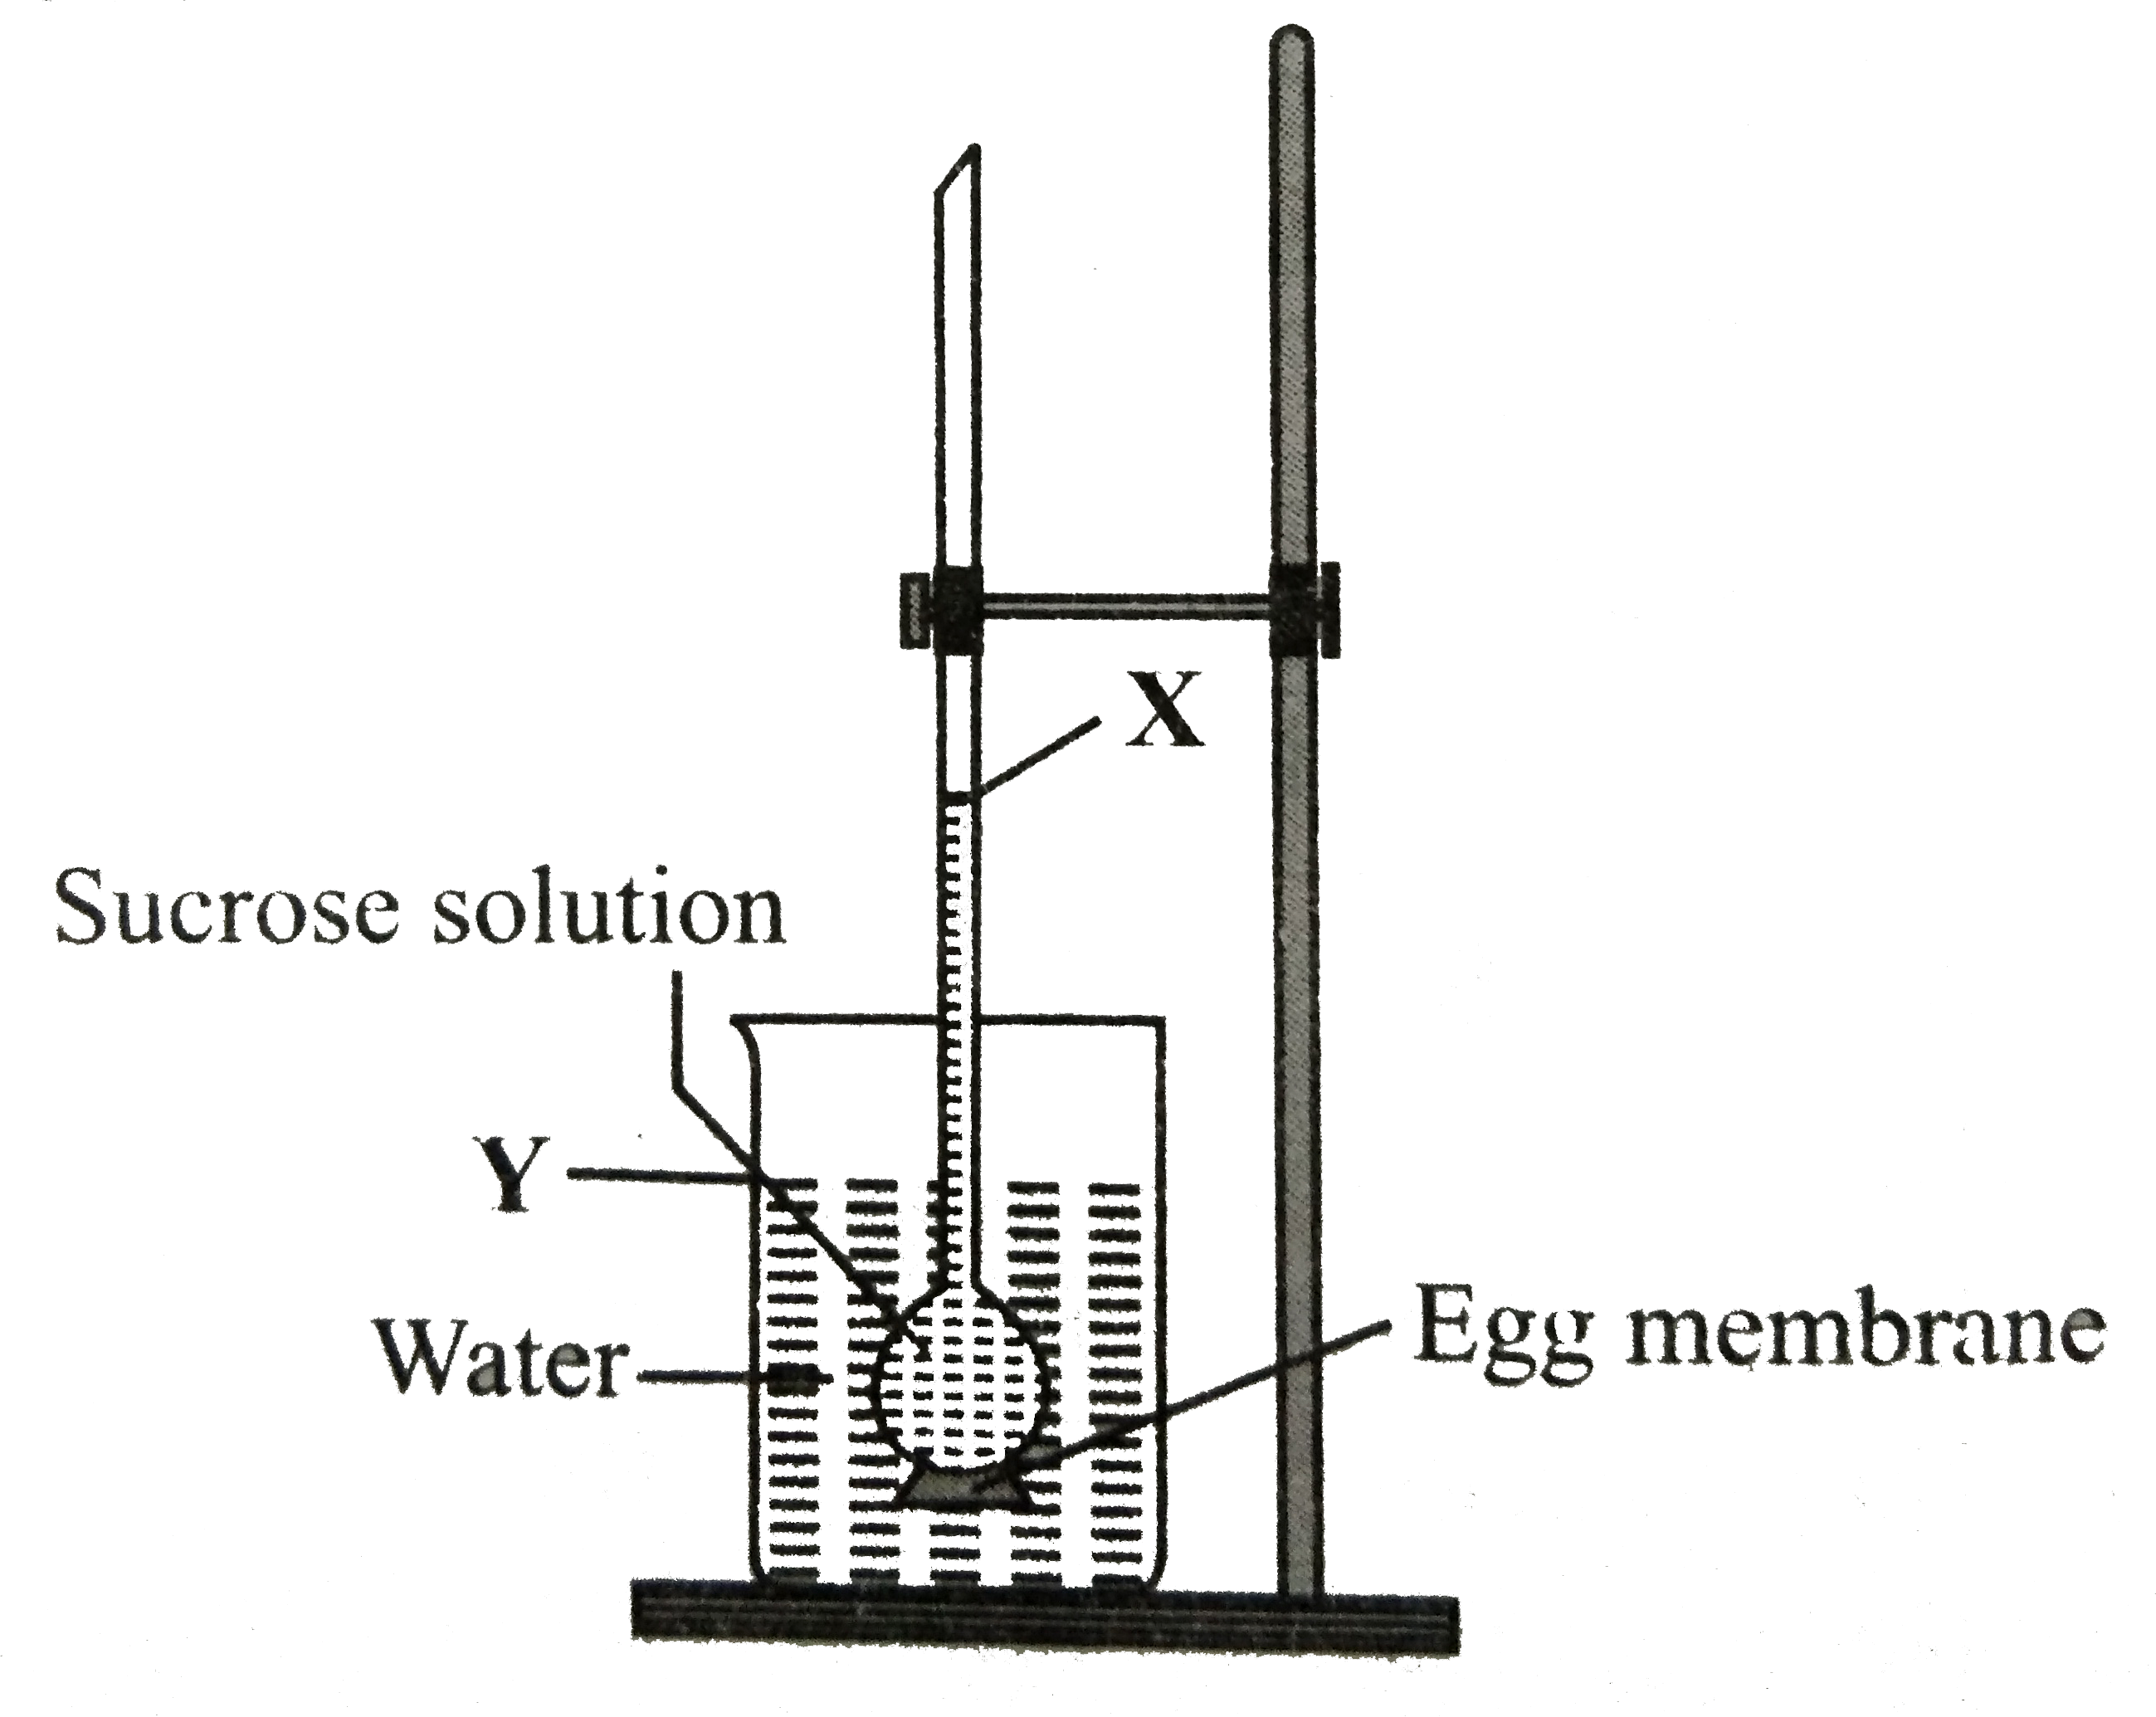
After few days which of the following would have occurred?
View SolutionGiven figure represents demonstration of osmosis by egg membrane osmoscope.

After few days which of the following would have occurred?
View SolutionWhich kind of reaction is shown by the following diagram?

View Solution

