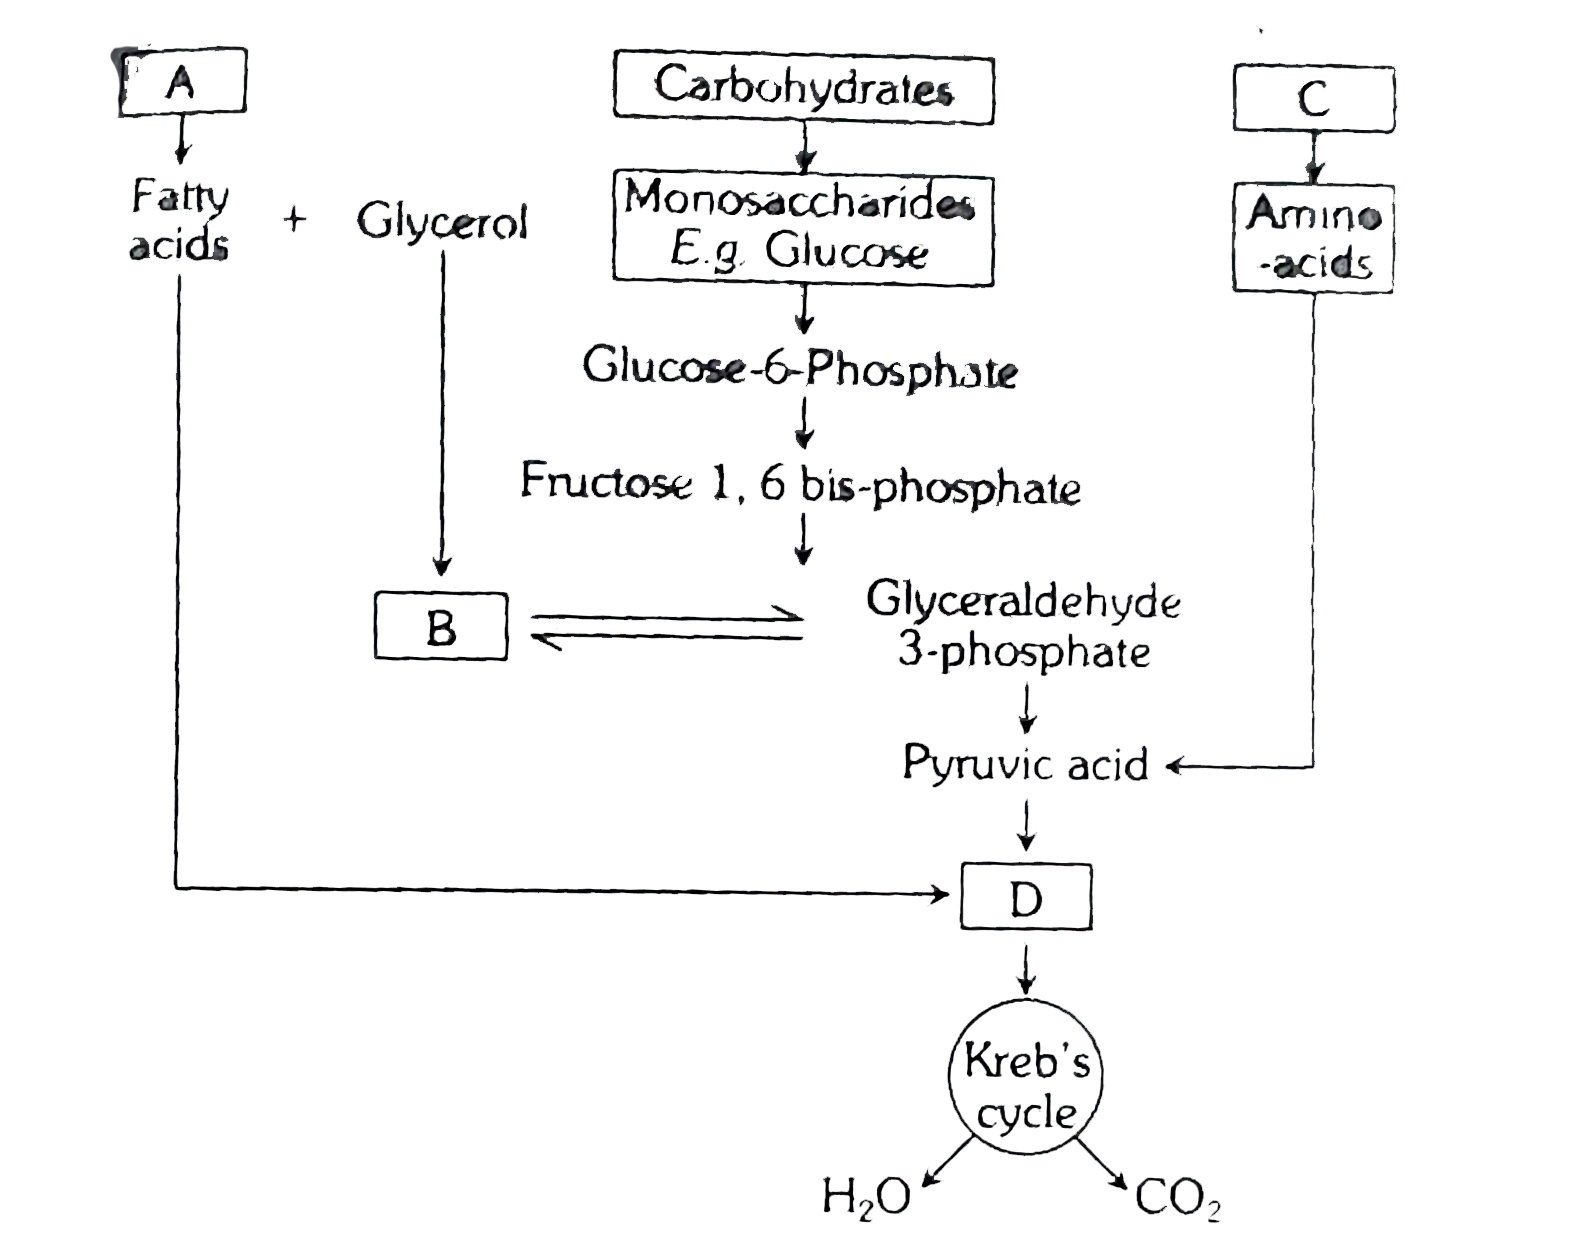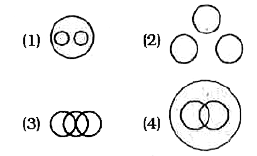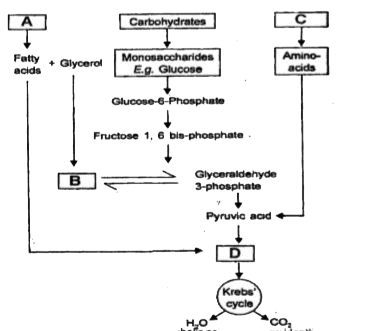
The above figure indicates the interrelationship among metabolic pathways. Now indentify A to D.

The correct Answer is:b
Similar Questions
Knowledge Check
In the above graph, point D indicates
ALimiting PoointBYield pointCBreaking pointDElastic limitThe given figure indicates the development of root nodule in soyabean
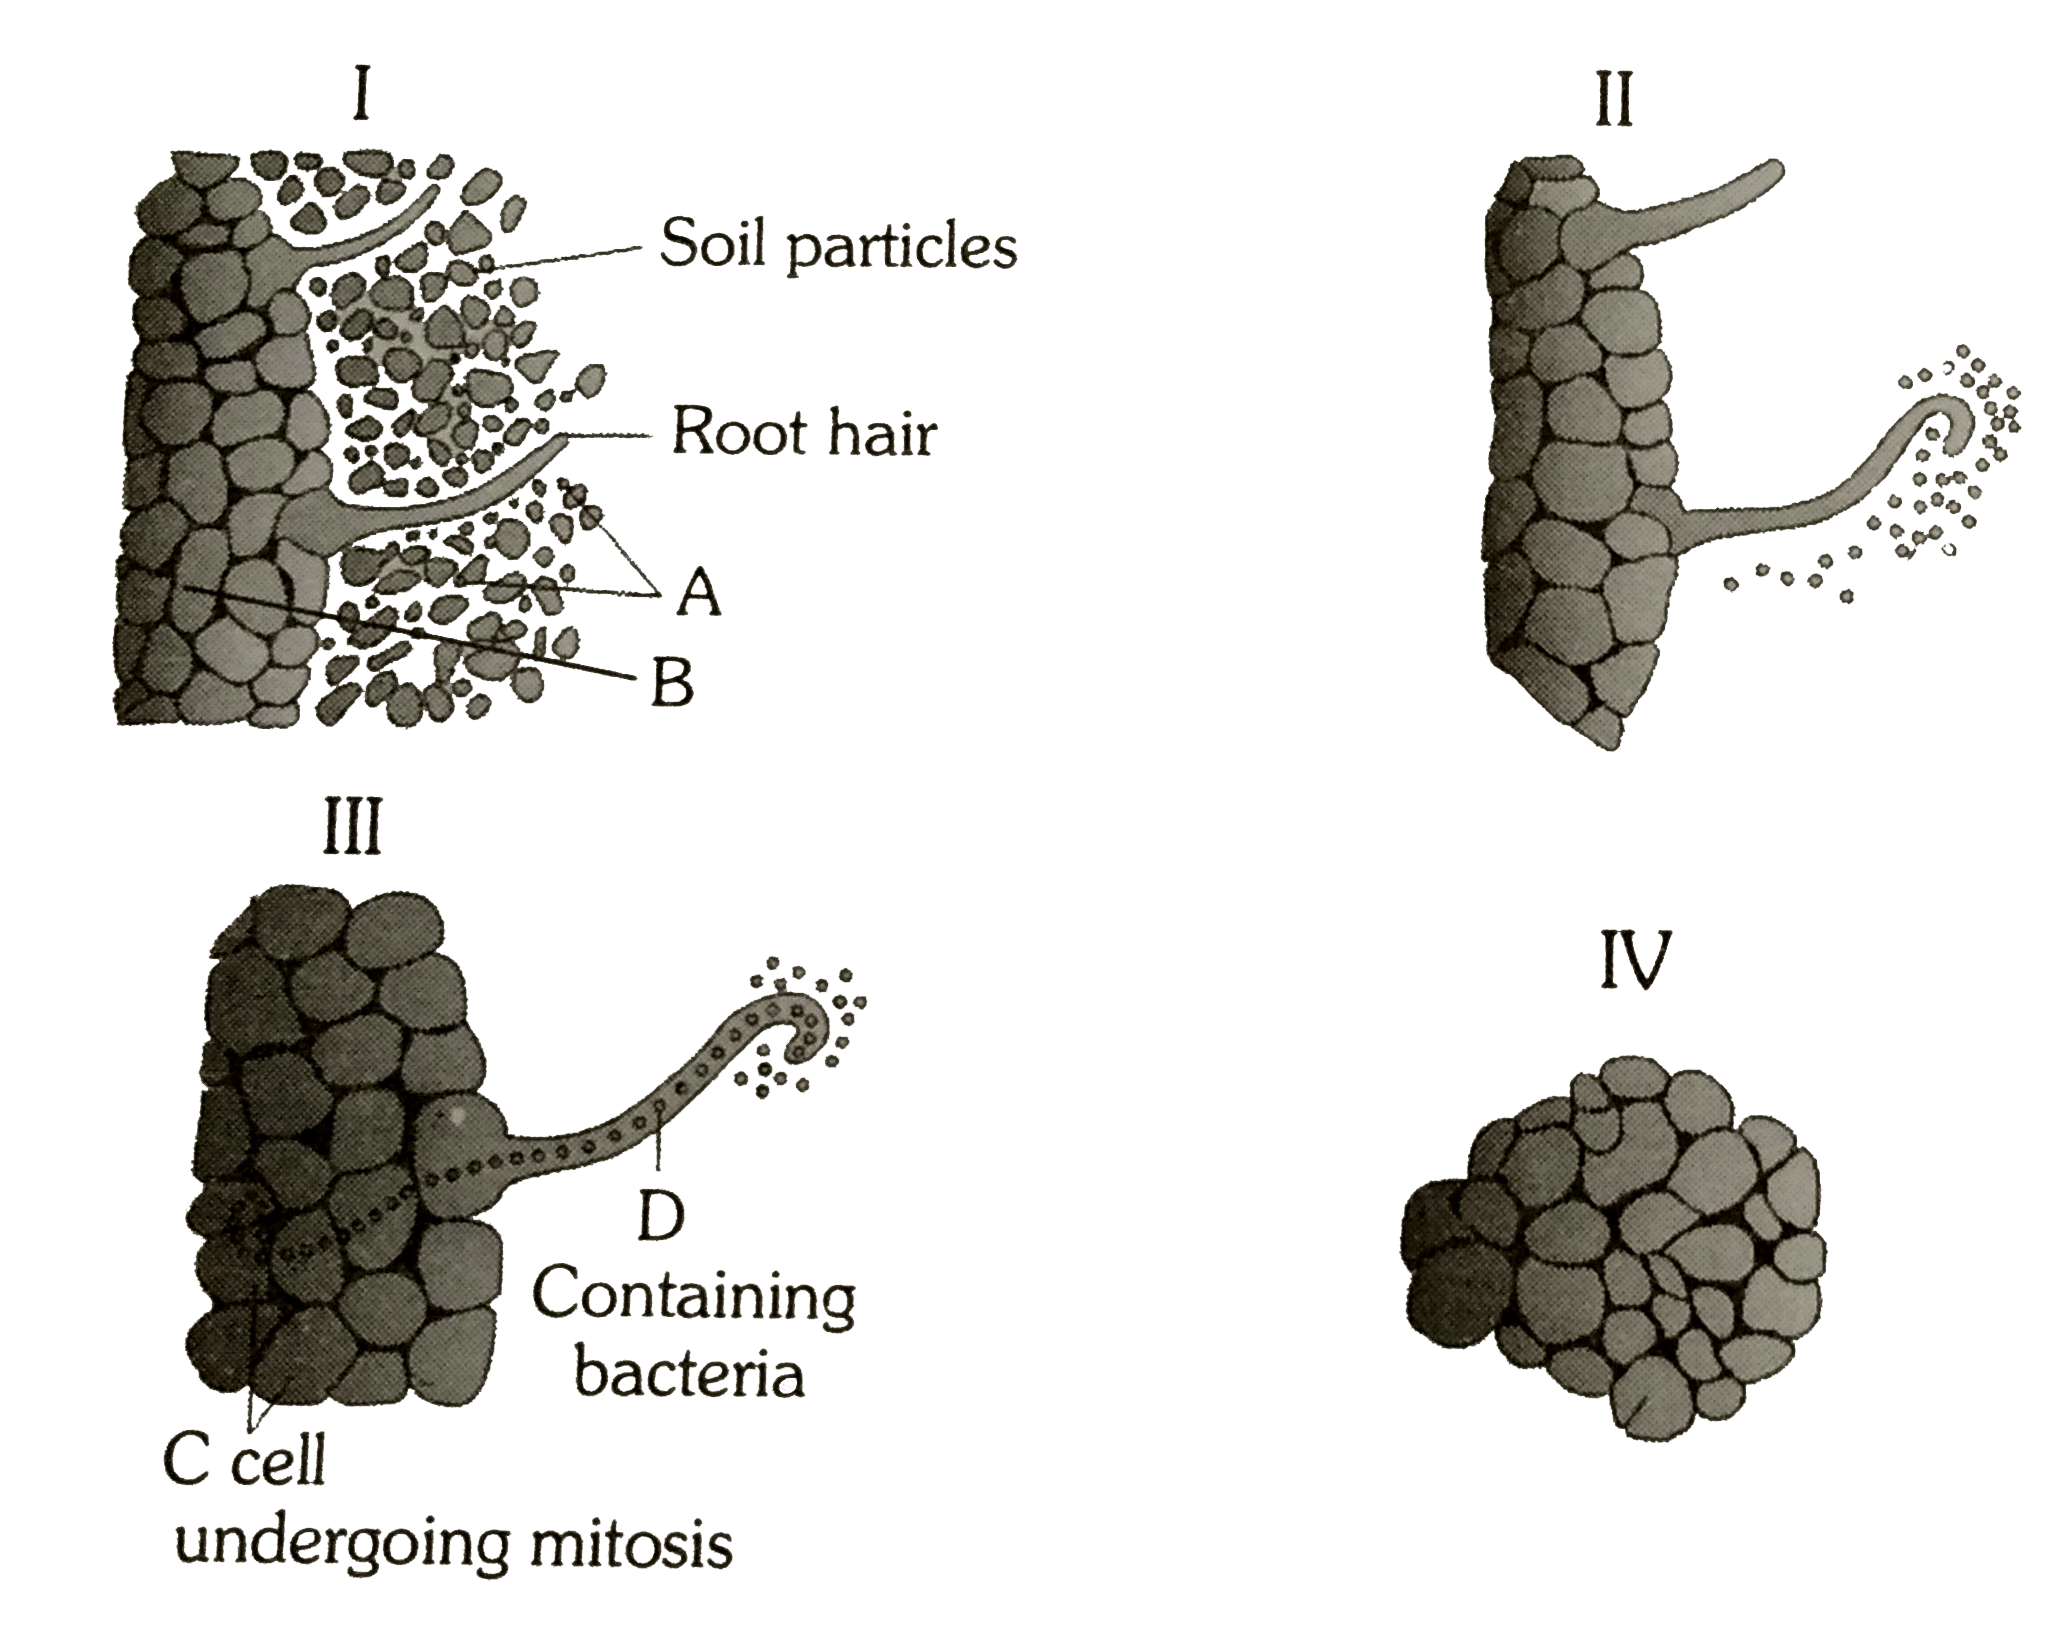
Identify A, B, C and D respectivelyAA- Nitrosomonas bacteria, B- Cortex cell, C - Inner cortex, D - Infection threadBA - Rhizobial bacteria, B - Endodermal cell , C - Inner Endodermis, D- Infection threadCA - Rhizobial bacteria, B - Cortex cell, C- Inner cortex, D - Infection threadDA - Rhizobial bacteria, B - Cortex cell, C - Outer cortex, D - Infection threadThe given figure indicates the stages of seed gremination
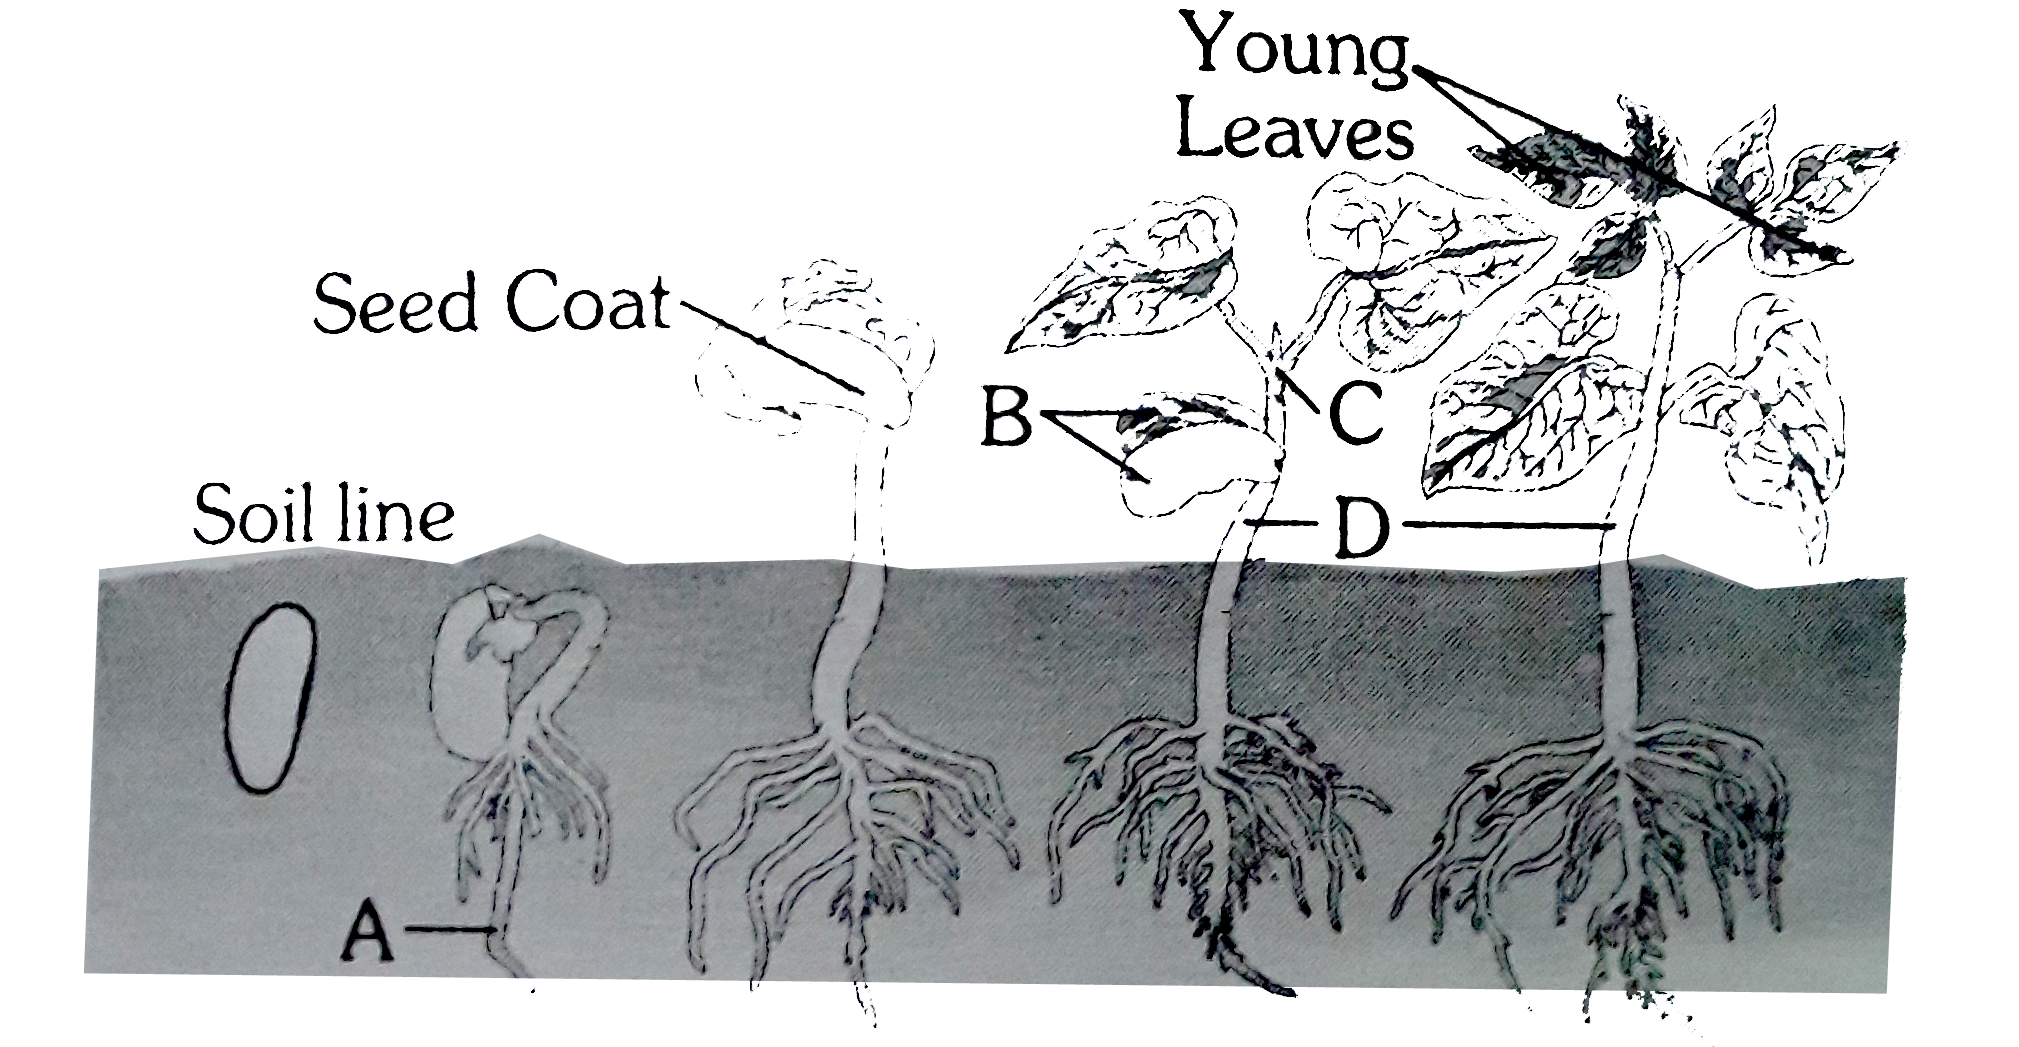
Identify A,B,C and D respectiveltyARoot hair ,Cotyedons ,Epicotyl and HyocotylBMesocotyl ,Cotyedons ,Epicotyl and HyocotylCRadicle ,Cotyedons ,Epicotyl and HyocotylDPlumule ,Cotyedons ,Epicotyl and Hyocotyl
Read the following statements a. Removal of CO2, from amino acid histidine converts it into an amine. b. Metabolites are converted into each other in a series of linked reactions called metabolic pathways. c. There is no uncatalyzed metabolic conversion in living systems. d. In living systems, the proteins with catalyti power are known as enzymes. How many above statements are correct?
View SolutionRead the following statements a. Removal of CO, from amino acid histidine converts it into an amine. b. Metabolites are converted into each other in a series of linked reactions called metabolic pathways. c. There is no uncatalyzed metabolic conversion in living systems. d. In living systems, the proteins with catalyti power are known as enzymes. How many above statements are correct?
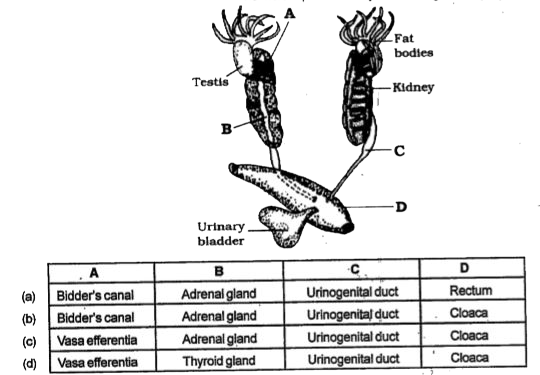
View SolutionGo through the following figure indicating the male reproductive system of frog. Identify Ato D-
View SolutionThe given figure represents posterior region of male cockroach. Indentify the parts labelled as A,B,C and D
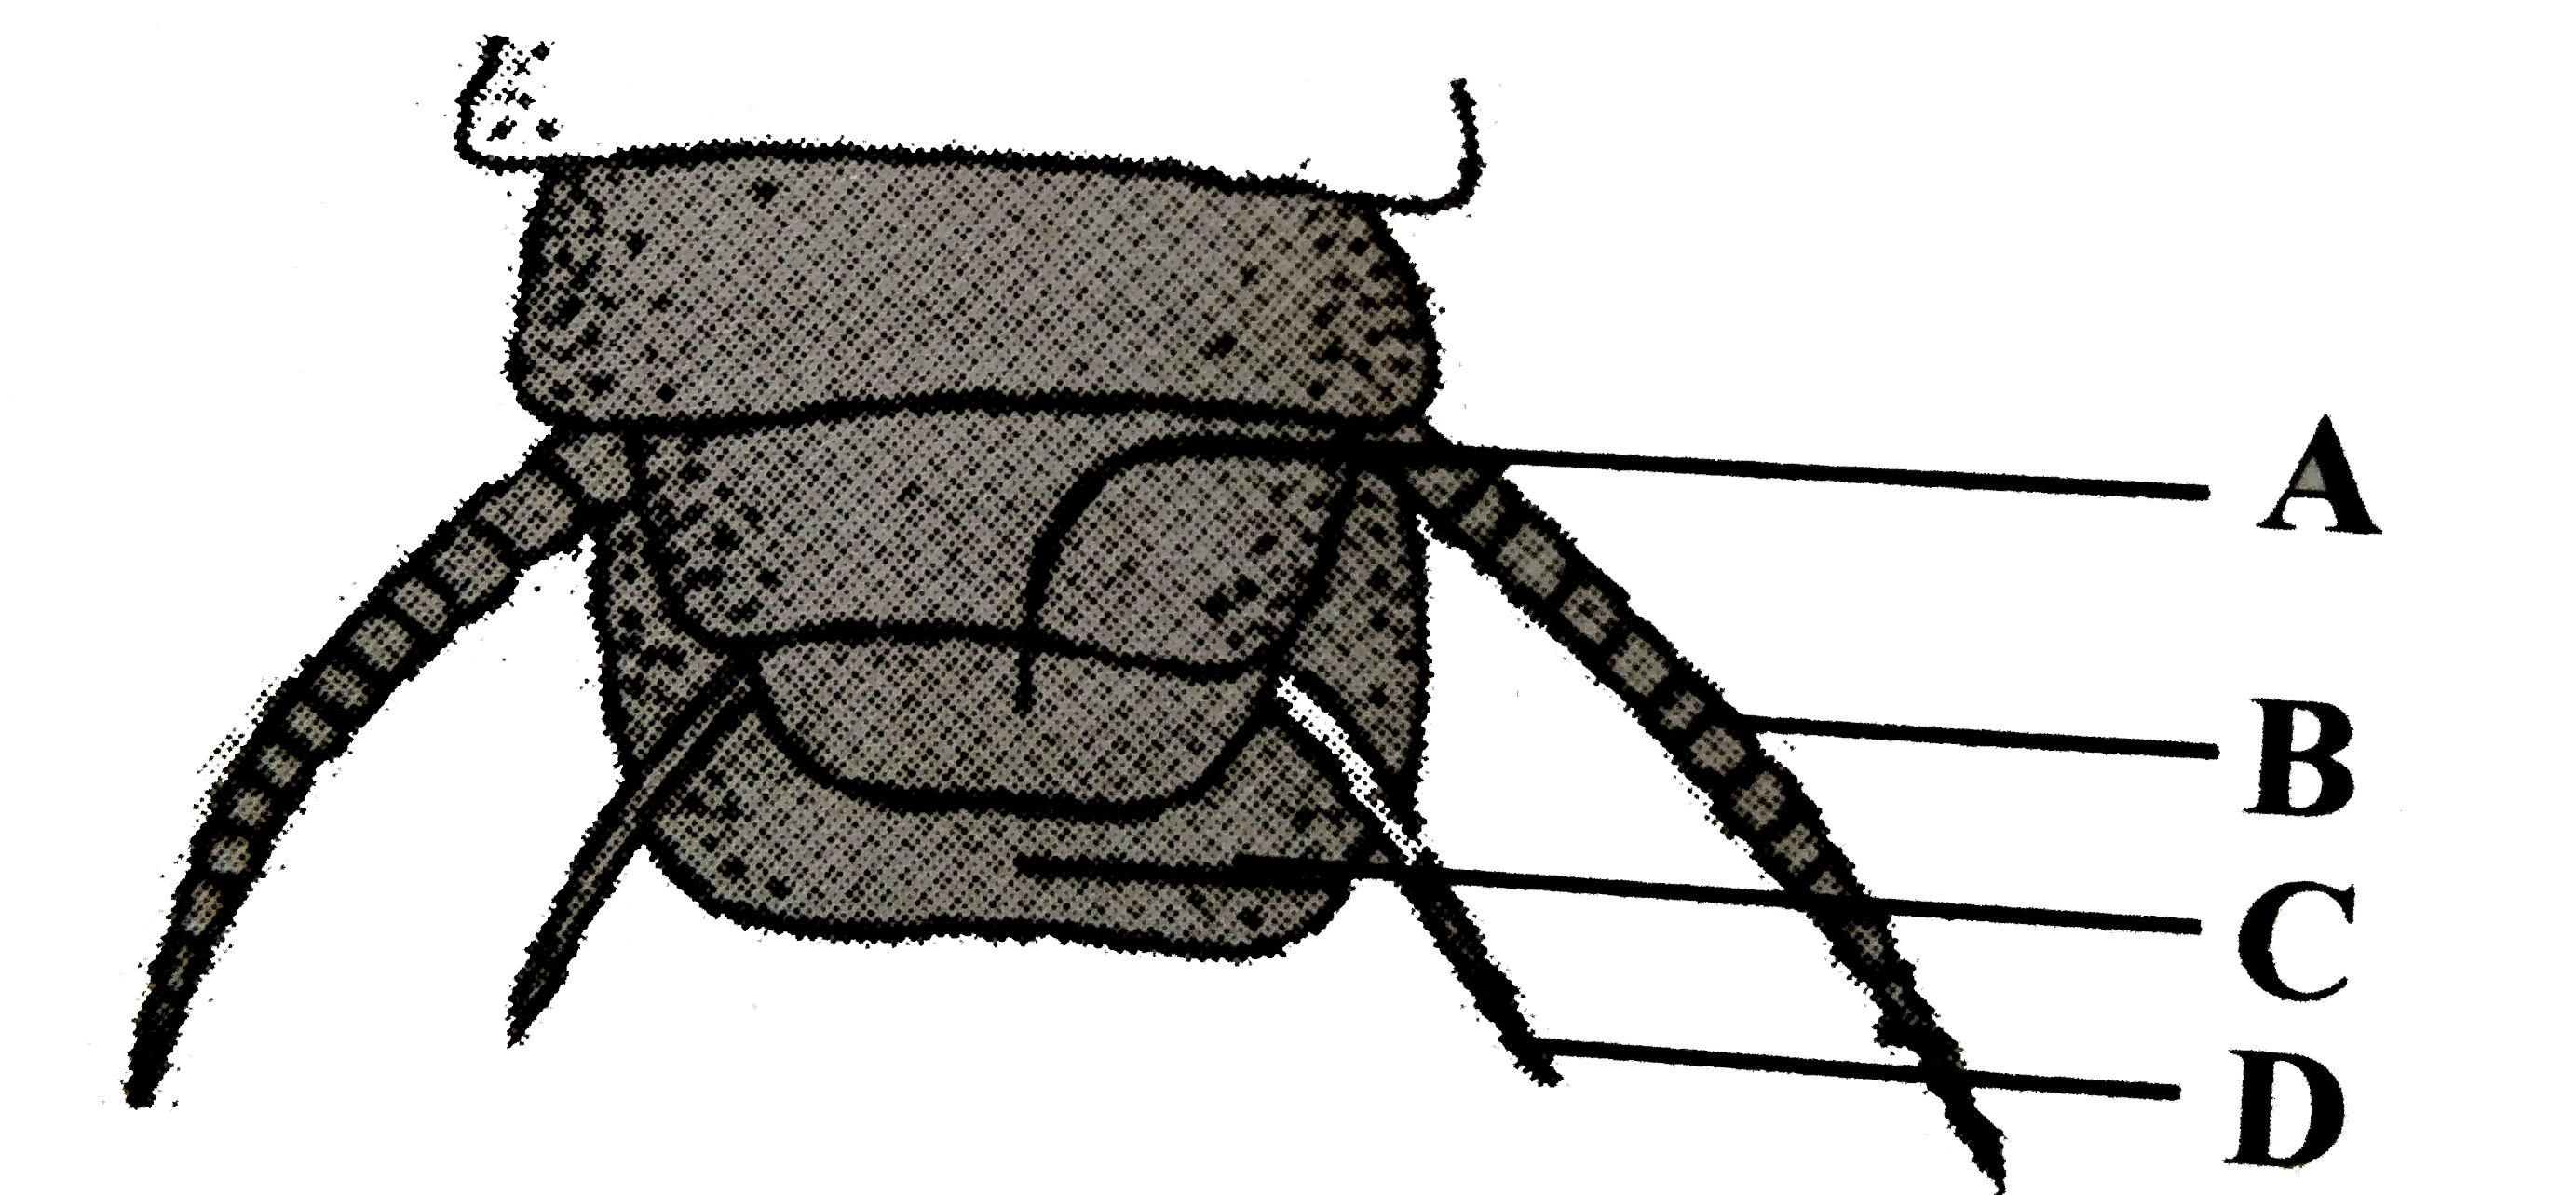
View SolutionThe given figure represents posterior region of male cockroach. Indentify the parts labelled as A,B,C and D

View Solution

