Most of the tissues and cell types represent
Division phase
Elongation phase
Enlargement phase
maturation phase
The correct Answer is:D
To answer the question "Most of the tissues and cell types represent which phase?", we can follow these steps:
1. Understand Plant Growth Phases: Plant growth is divided into three main phases: meristematic phase, elongation phase, and maturation phase. Each phase has distinct characteristics and functions.
2. Define Each Phase:
- Meristematic Phase: This is where active cell division occurs. Cells in this phase are undifferentiated and capable of continuous division.
- Elongation Phase: Following the meristematic phase, this phase involves the elongation of cells, where cells increase in size but are still not fully differentiated.
- Maturation Phase: This phase involves the maturation of cells, where they differentiate and develop specific functions. The cells undergo changes such as cell wall thickening and protoplasmic modifications.
3. Identify the Phase Represented by Most Tissues and Cell Types:
- Most of the tissues and cell types in plants are found in the maturation phase. This is because, during this phase, cells have differentiated into various specialized types that make up the plant's tissues.
4. Select the Correct Option: Based on the understanding that most tissues and cell types represent the maturation phase, we conclude that the correct answer to the question is the maturation phase.
Final Answer:
Most of the tissues and cell types represent the maturation phase.
---
- Meristematic Phase: This is where active cell division occurs. Cells in this phase are undifferentiated and capable of continuous division.
- Elongation Phase: Following the meristematic phase, this phase involves the elongation of cells, where cells increase in size but are still not fully differentiated.
- Maturation Phase: This phase involves the maturation of cells, where they differentiate and develop specific functions. The cells undergo changes such as cell wall thickening and protoplasmic modifications.
- Most of the tissues and cell types in plants are found in the maturation phase. This is because, during this phase, cells have differentiated into various specialized types that make up the plant's tissues.
Most of the tissues and cell types represent the maturation phase.
Similar Questions
Knowledge Check
Most of the cells in areolar tissues are
AFibroblastsBMacrophagesCMast cellsDAll of the aboveMyeloid tissue is a type of-
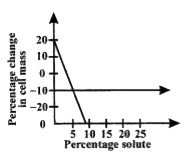
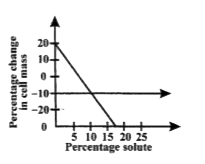
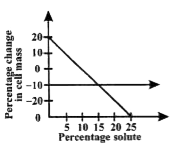
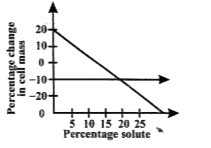
Ahaematopoietic tissueBcartilage tissueCmuscular tissueDareolar tissueThe effect of solute concentration of the mass of tissue cells is studied.It is observed from the collected data that the tissue cells were isotonic to 10 % solute concentration Which of the following graph represents that the cells are isotonic 10 % solute concentrations
A B
B C
C D
D
(a) Which is the most widely distributed connective tissue in the animal body ? What is its composition ?
(b) List atleast three types of cells present in the matrix of such connective tissue with one function of each.
View SolutionCompound epithelium || difference between epithelium and connective tissue || composition matrix and cell types || types OF connective tissue || loose and dense CT || reticular and pigmented mucous CT
View SolutionMost of the cells present in areolar connective tissue are :-
View SolutionOpen type of circulatory system is the system in which blood is pumped out of the heart and the cells and tissues are directly bathed in it. This type of circulatory system is found in :-
View SolutionRead the given statements and select option representing correct statements.
A. Anatomy deals with internal structure but not the functional organisation of plants.
B. Tissue arises as a result of interactions among the constituent cells
C. Properties of tissues are present in constituent cells.
D. Tissue is a group of ontogenetically and functionally similar cells but structurally may be similar or dissimilar.
View Solution
