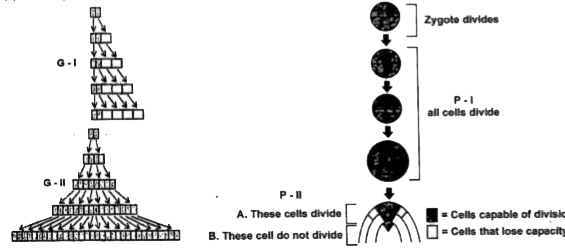
Identify Growth(s) and Phase(s) in above diagrammatic representation -
G-I— Arithmetic growth, G = II — Geometric growth, P-I- Geometric Phase, P-II - Arithmetic Phase
G-I— Arithmetic growth, G-II — Geometric growth, P-I-Arithmetic Phase, P-II-Geometric Phase
G-I- Geometric growth, G-II ---Arithmetic growth, P-I Geometric Phase, P-II — Arithmetic Phase
G-I- Geometric growth, G-II— Arithmetic growth, P-I- Arithmetic Phase, P - II --- Geometric Phase
The correct Answer is:A
Similar Questions
Knowledge Check
- Question 1 - Select One
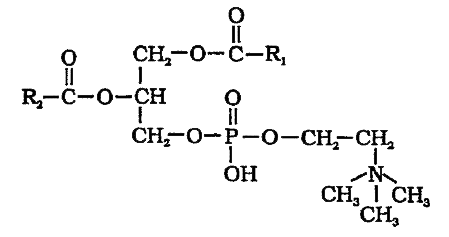
The above diagrammatic representation is the formula of -ALecithinBCholesterolCUridylic acidDPhosphatic acid - Question 2 - Select One
The objective of diagrammatic representation of data is
AClassificationBSummarizationCPresentationDTabulation - Question 3 - Select One
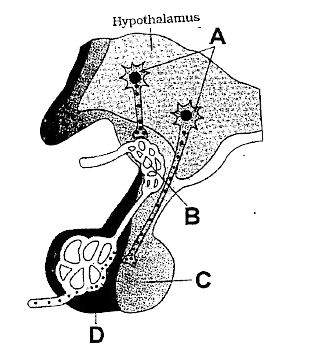
Identify A to D -AA - Hypothalamic neurons, B - Hypothalamic artery, C - Prts intermediaBA - Epithalamic neurons, B - Hypothalamic vein, C - Pars disfalis, D - pars imtermediaCA - Hypothalamic neurons, B - Portal circulation, C - Anterior pituitary, D - Posterior pituitaryDA - Hypothalamic neurons, B - Portal circulation, C - Posterior pituitary, D - Anterior pituitary
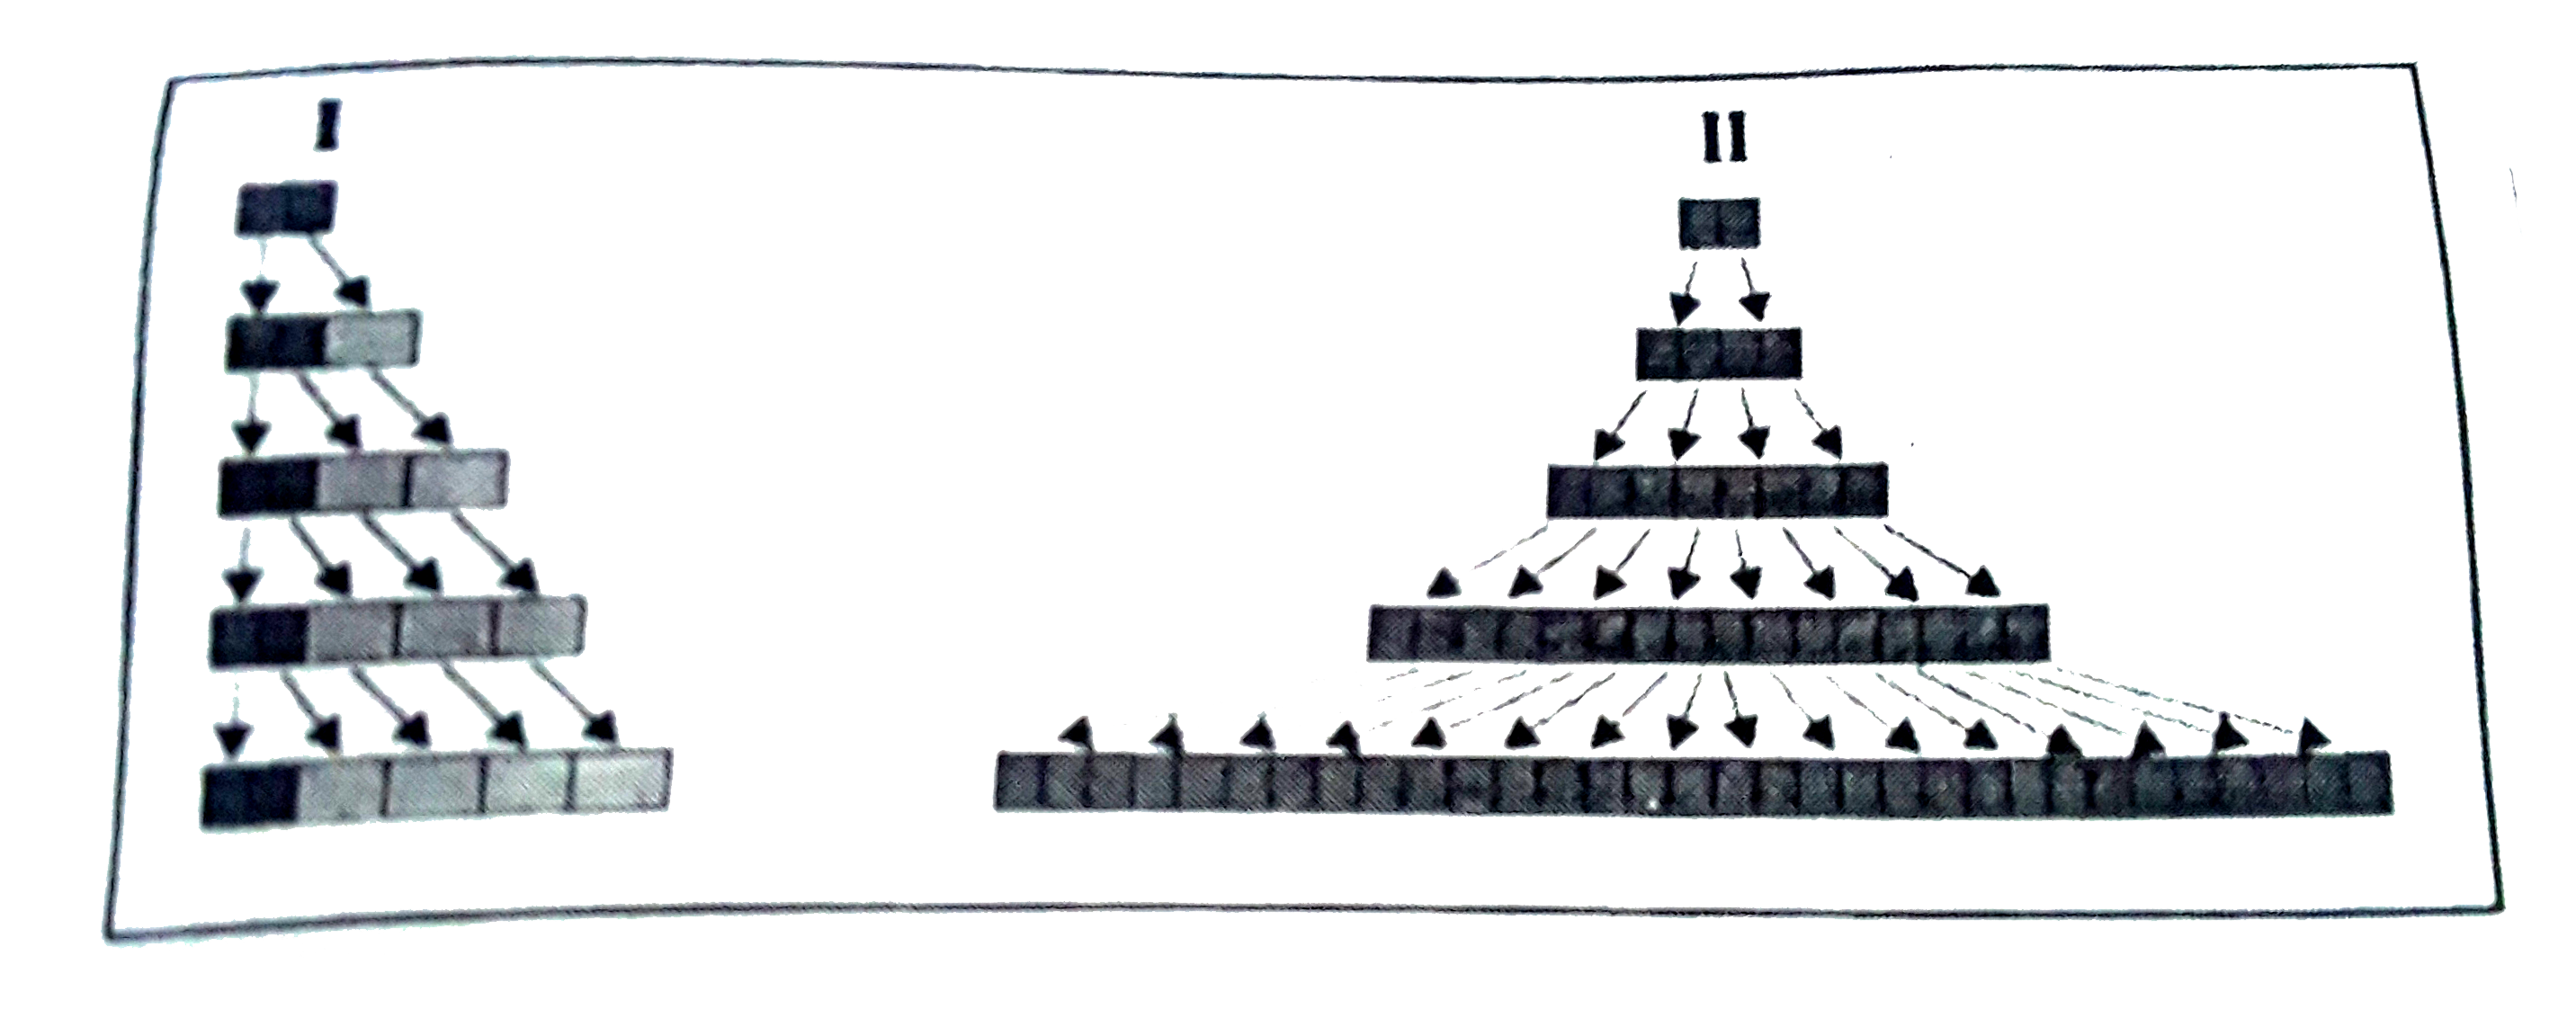
Identify the following diagrammatic representation of types of growth and their mathematical expression.
 View Solution
Identify the following diagrammatic representation of types of growth and their mathematical expression.
 View Solution
Identify A and B bonds in the following diagrammatic representation of a portion of glycogen -
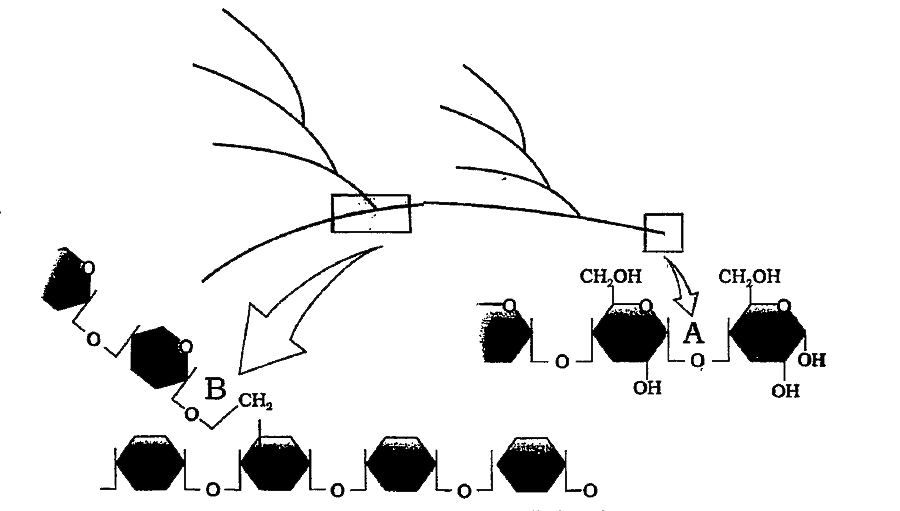 View Solution
_______ is a diagrammatic representation of a program logic.
View SolutionSee the given diagrammatic representation. Identify A,B,C and D
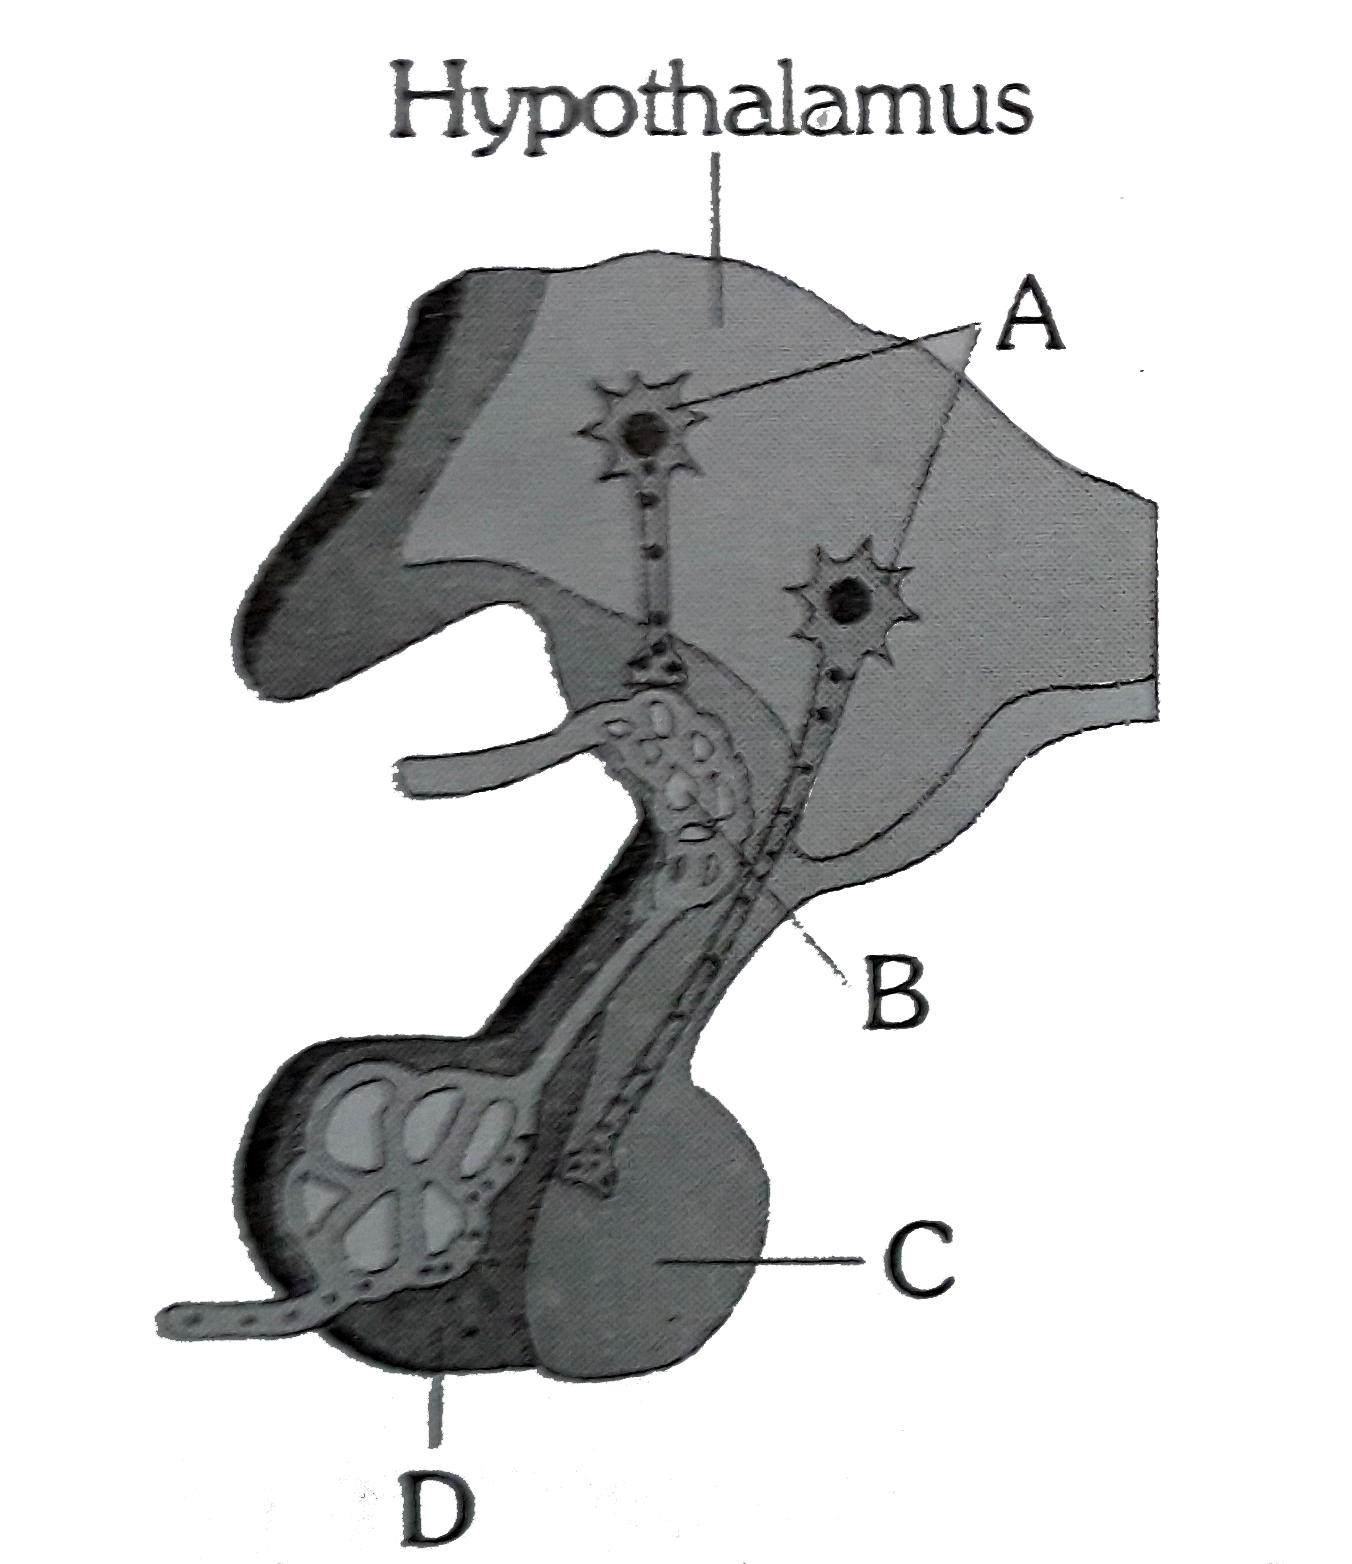 View Solution
