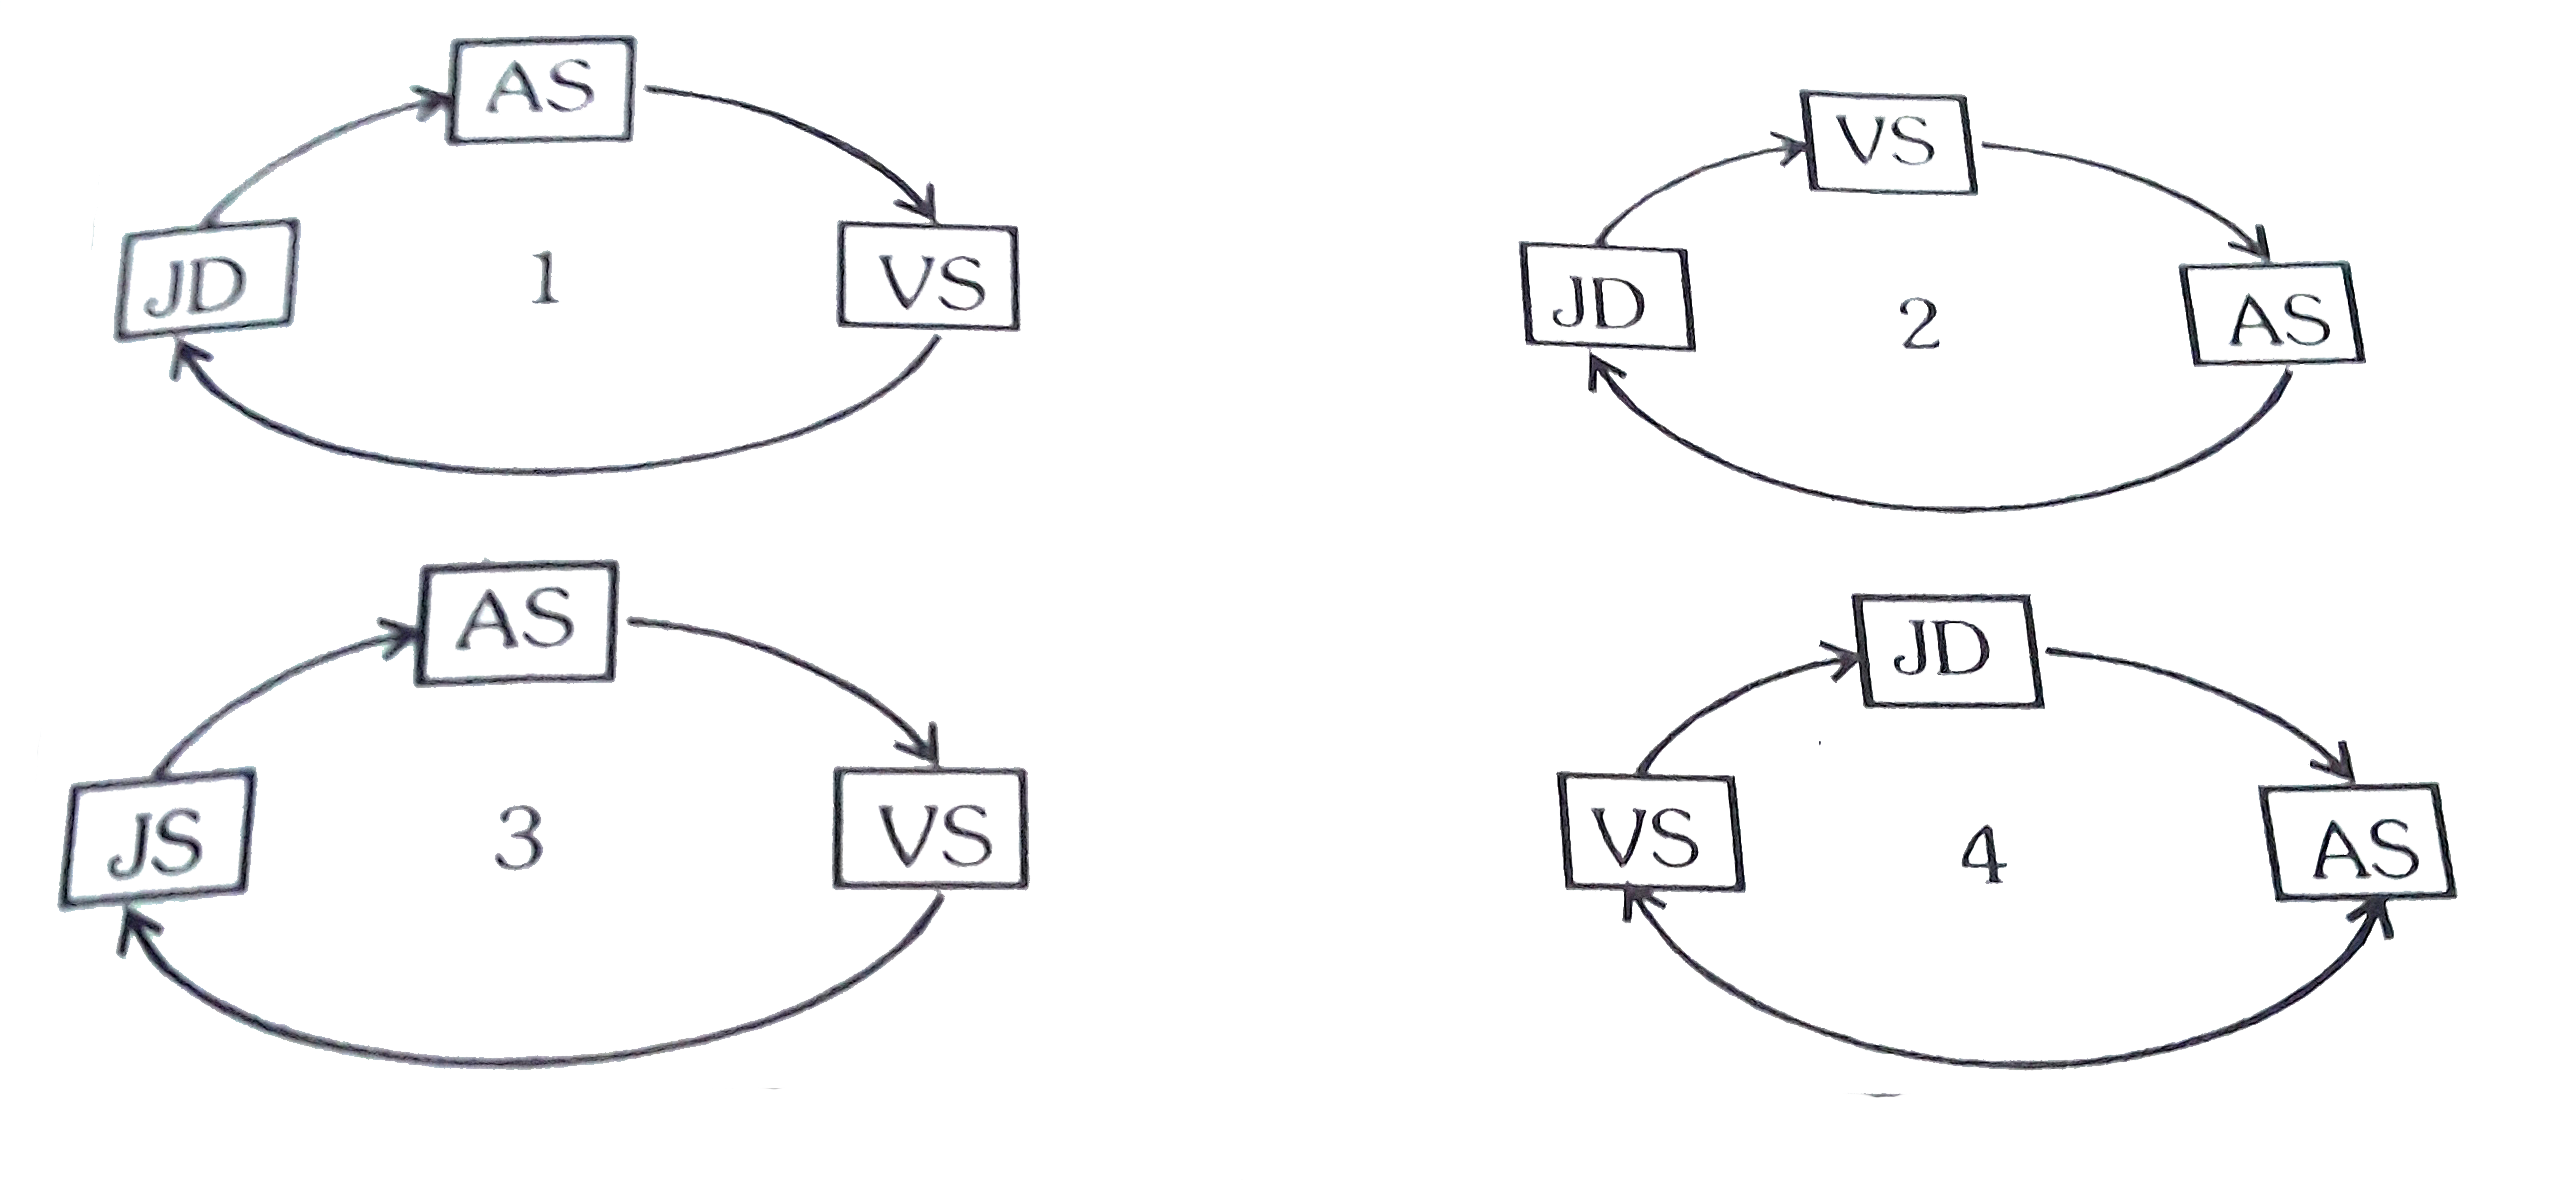
Which of the following diagram is/are wrong representation of cardiac cycle?

A
1 and 2
B
2 and 3
C
3 and 4
D
1 and 4
Video Solution
Text Solution
The correct Answer is:B
|
Answer
Step by step video, text & image solution for Which of the following diagram is/are wrong representation of cardiac cycle? by Biology experts to help you in doubts & scoring excellent marks in Class 12 exams.
Updated on:21/07/2023
Similar Questions
Knowledge Check
- Question 1 - Select One
Which of the following diagrams is not a correct representation of convergent evolution ?
A B
B C
C D
D
- Question 2 - Select One
The duration of cardiac cycle is
A0.8secB0.8μsecC0.08secD0.008sec - Question 3 - Select One
Ellingham diagram is a graphical representation of :
AΔH vs TBΔG vs TCΔG vs PD(ΔG−TΔS) vs T
Define cardiac cycle.
View SolutionThe given below diagram is the representation of
 View Solution
A cardiac impulse leads to the contraction and relaxation of the heart. Which of the following arrow diagrams correctly represents the flow of cardiac impulse in the heart?
View SolutionWhich of the following is wrong in case of representation of probability in percentage
View SolutionWhich of the following statement is wrong for second cardiac sound?
View Solution


