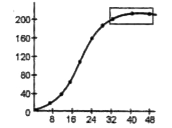
From the graph of population growth, select the correct option having correct value of rand the graph.
A

B

C

D

Text Solution
The correct Answer is:D
|
Similar Questions
Knowledge Check
Select the correct option for the following graph :
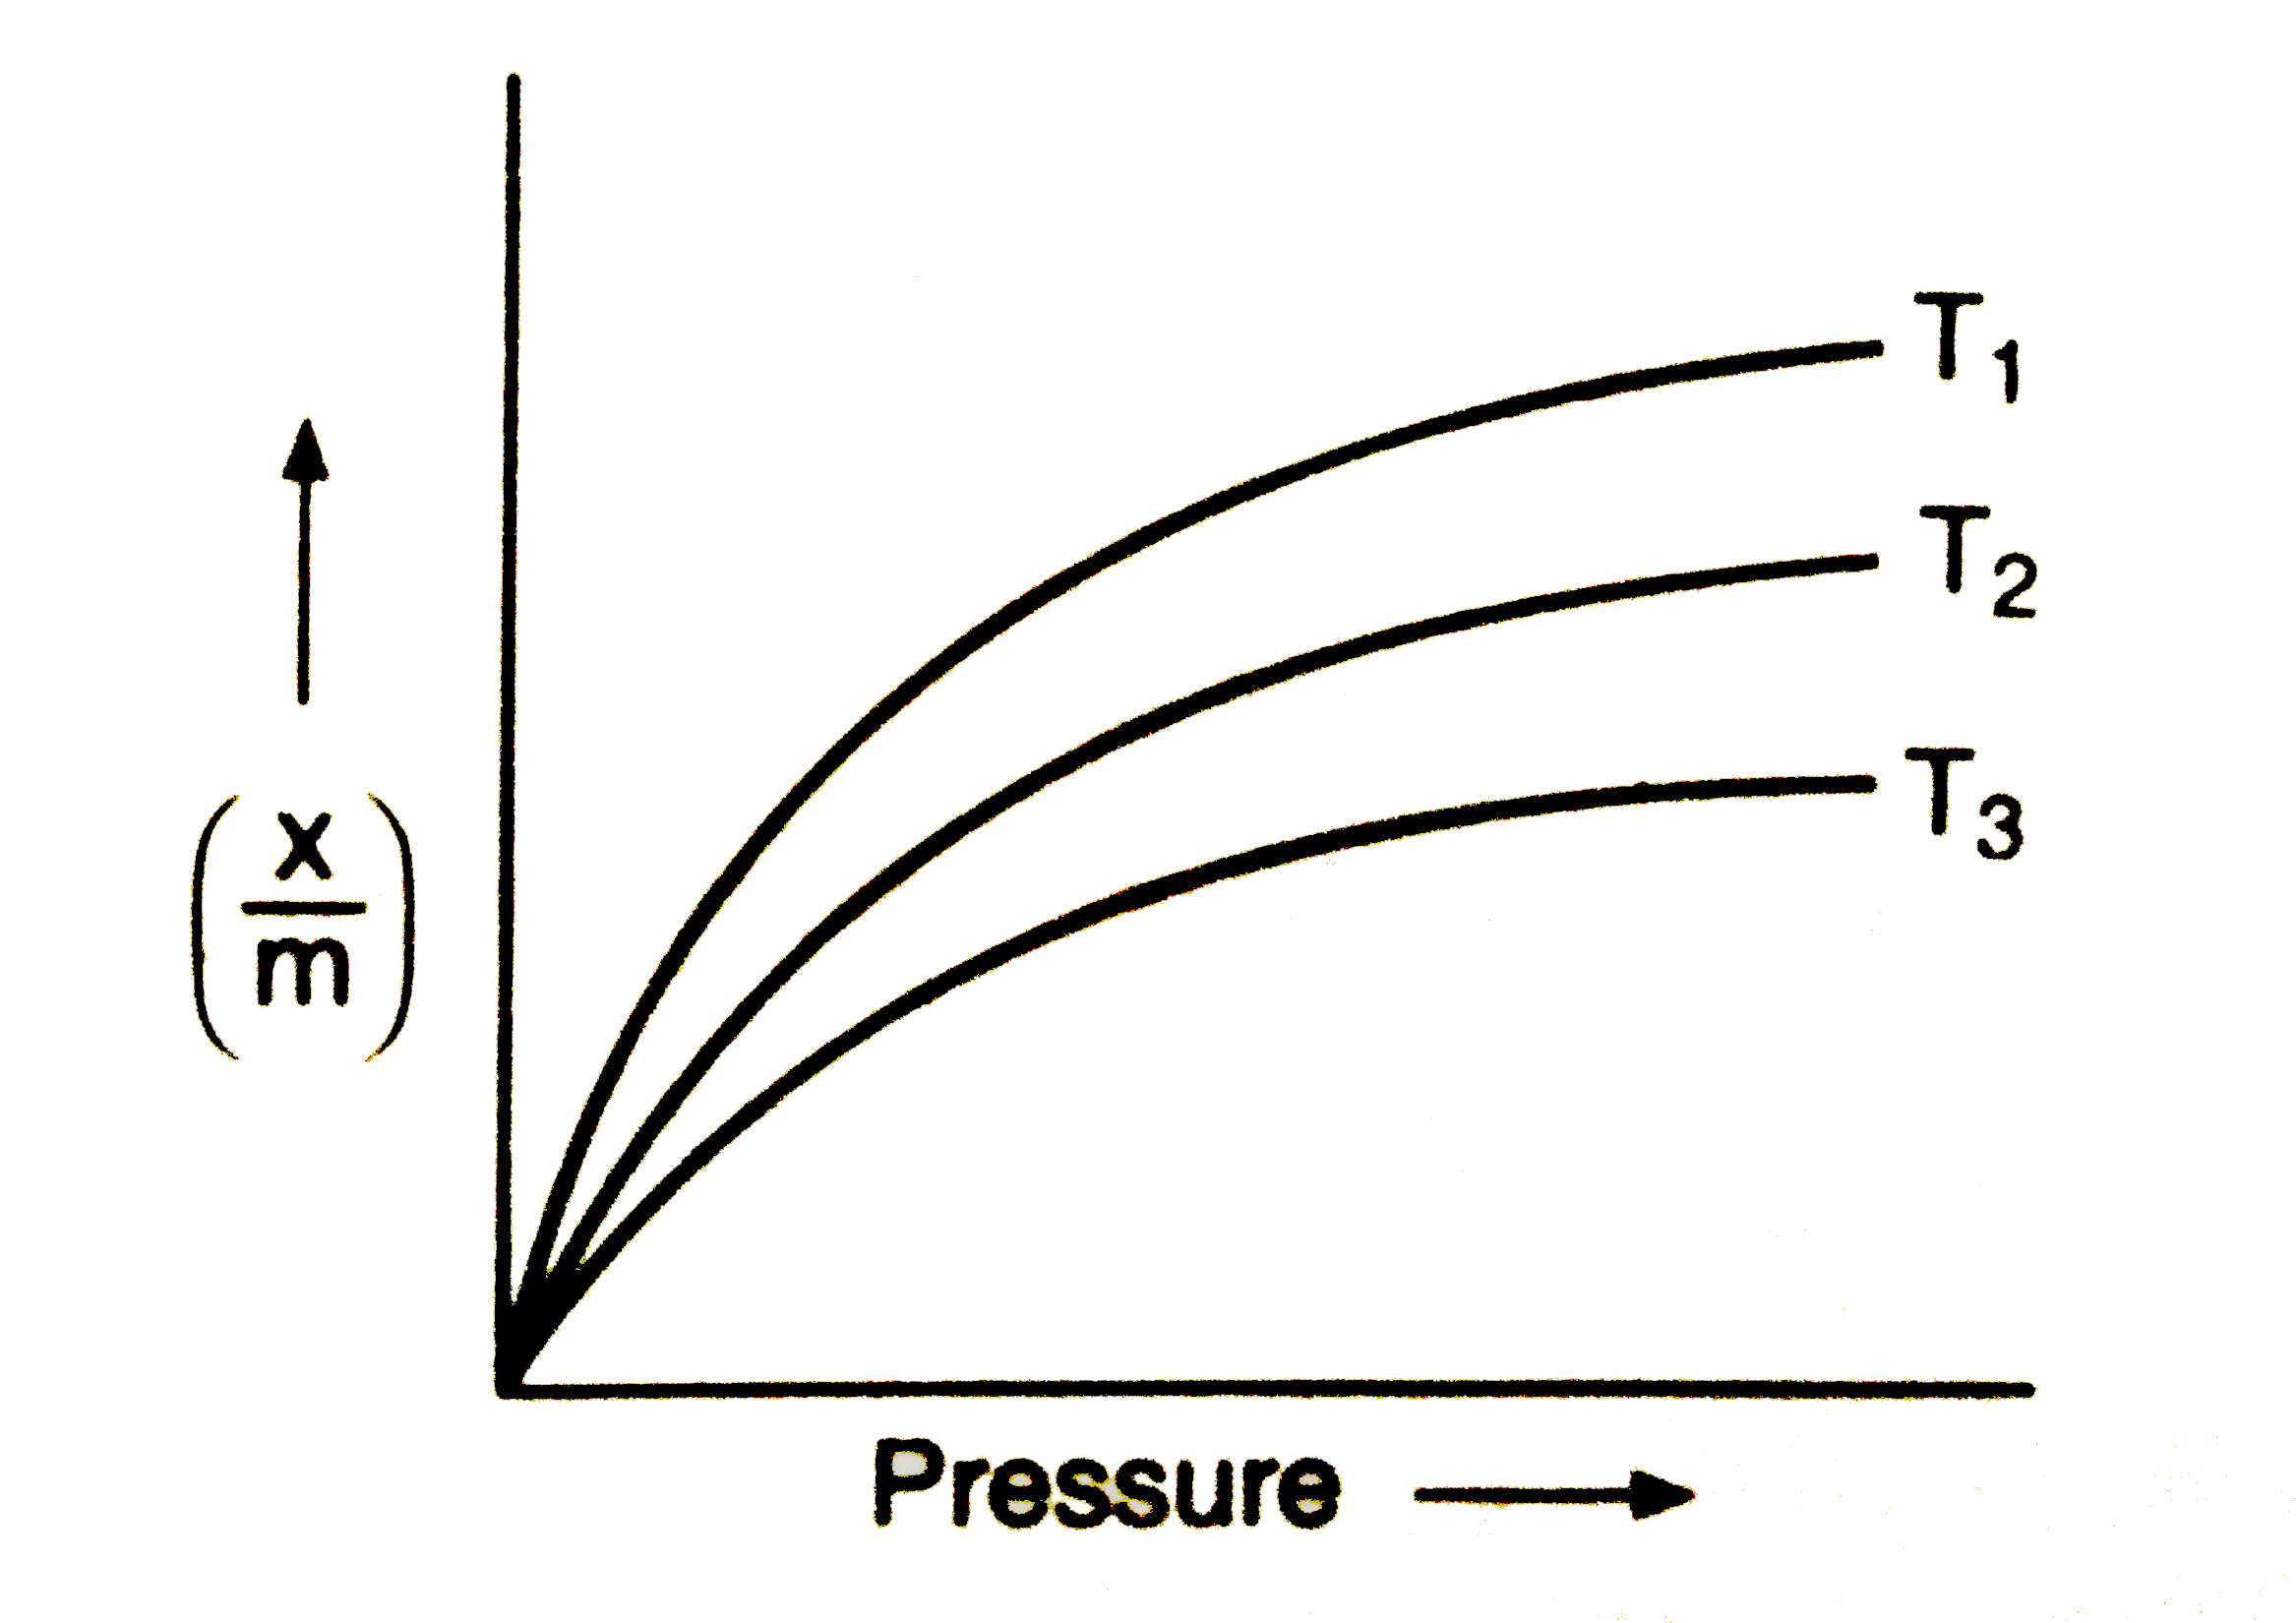 AT1>T2>T3BT1=T2=T3CT1<T2<T3DT1>T2<T3
On the P−T graph of an ideal gas, choose the correct option(s):
AAdiabatic process will be a straight line.BIsochoric process will be straight line passing through the origin.Cadiabatic curve will have a positive slope.Dthe slope of adiabatic curve is proportional T.Select the correct graph for Bohr atom:
A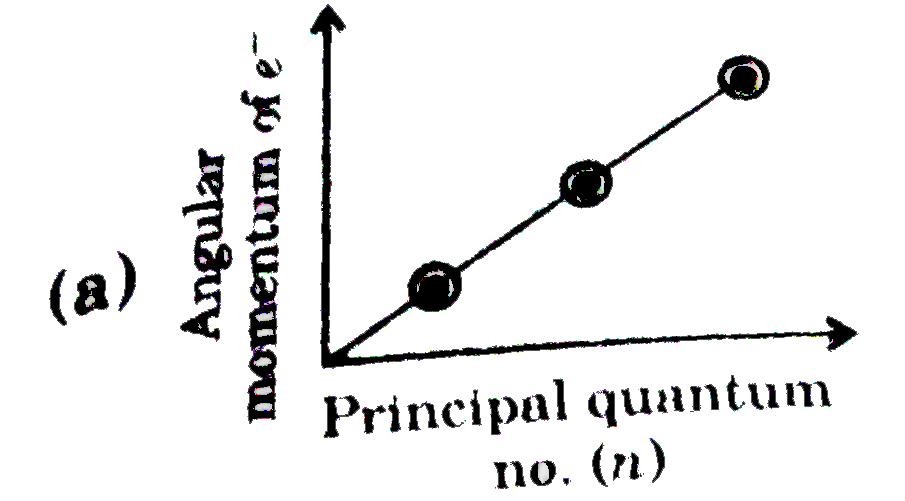 B
B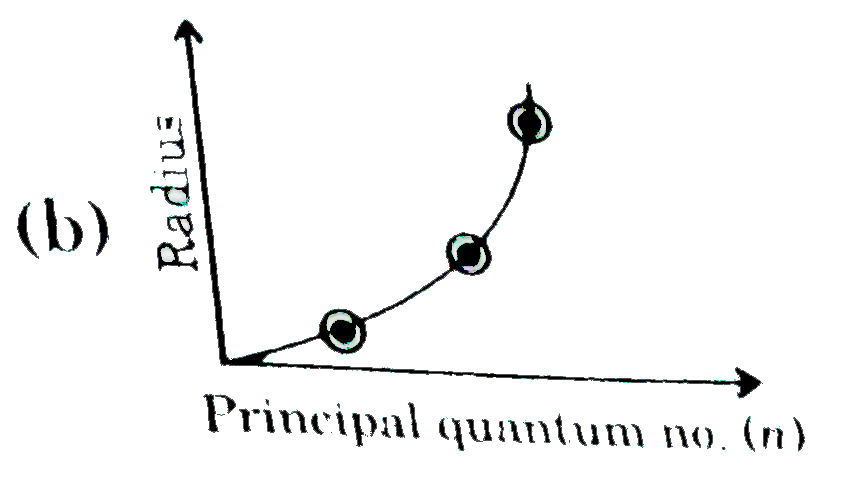 C
C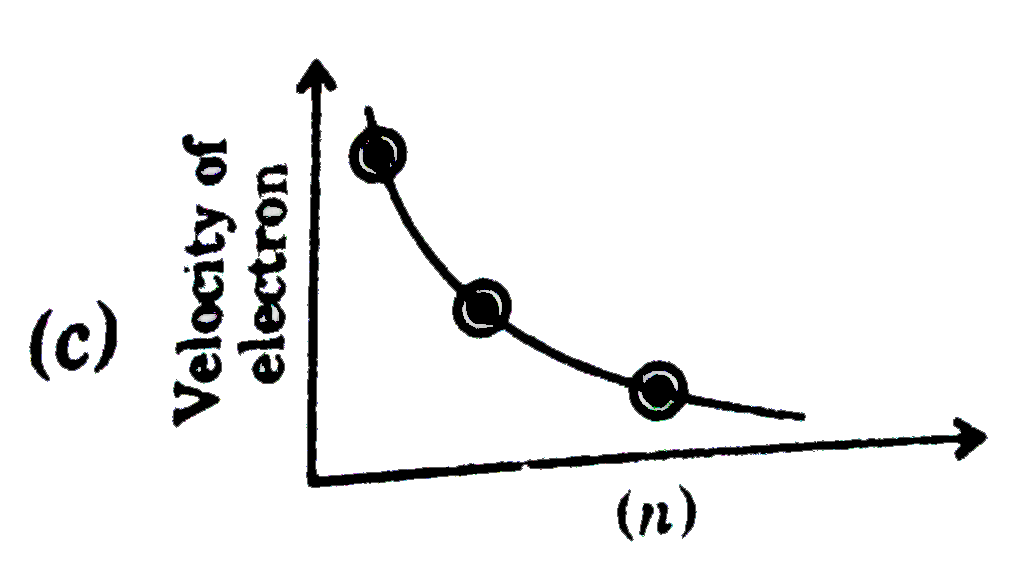 D
D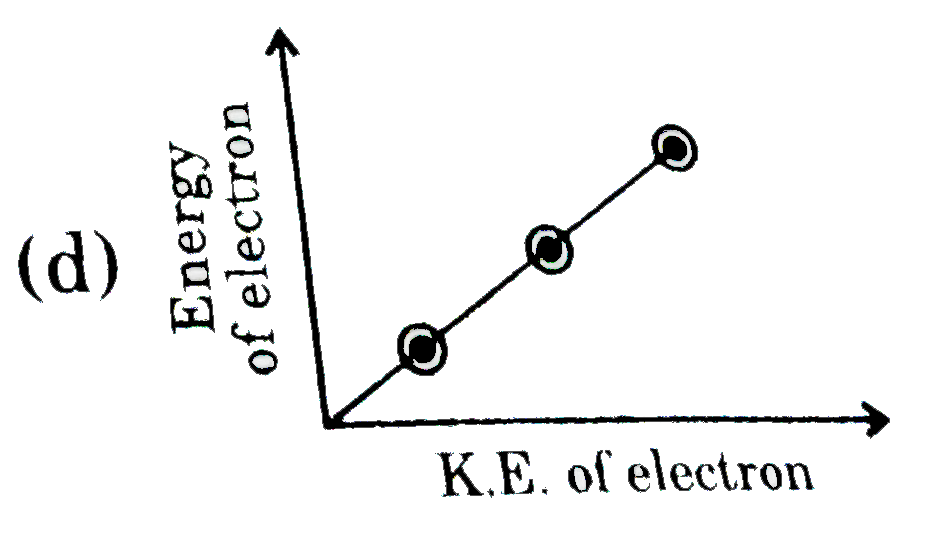
Select the correct stoichiometry and its ksp value according to given graphs
View SolutionSelect the correct stoichiometry and its ksp value according to given graphs
View SolutionConsidering the graph of 1s , choose the correct option:
View SolutionSelect the correct statement on the basis of the given graph :
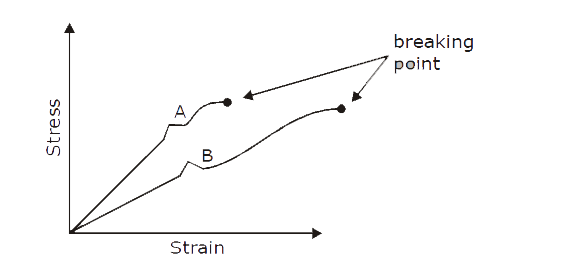
View SolutionGo through the population growth formula
dNdt=rN
Now select the correct option -
View Solution

