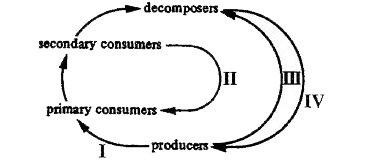
The diagram below shows the flow of materials between trophic levels. Which arrow is incorrect?

A
I
B
II
C
III
D
IV
Video Solution
Text Solution
The correct Answer is:B
|
Answer
Step by step video, text & image solution for The diagram below shows the flow of materials between trophic levels. Which arrow is incorrect? by Biology experts to help you in doubts & scoring excellent marks in Class 12 exams.
Updated on:21/07/2023
Similar Questions
Knowledge Check
- Question 1 - Select One
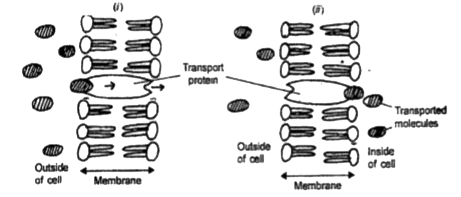
The diagram shows the transportation of materials by
 ASimple diffusionBFacilitated DiffusionCPrimary Active transportDSecondary Active transport
 - Question 2 - Select One
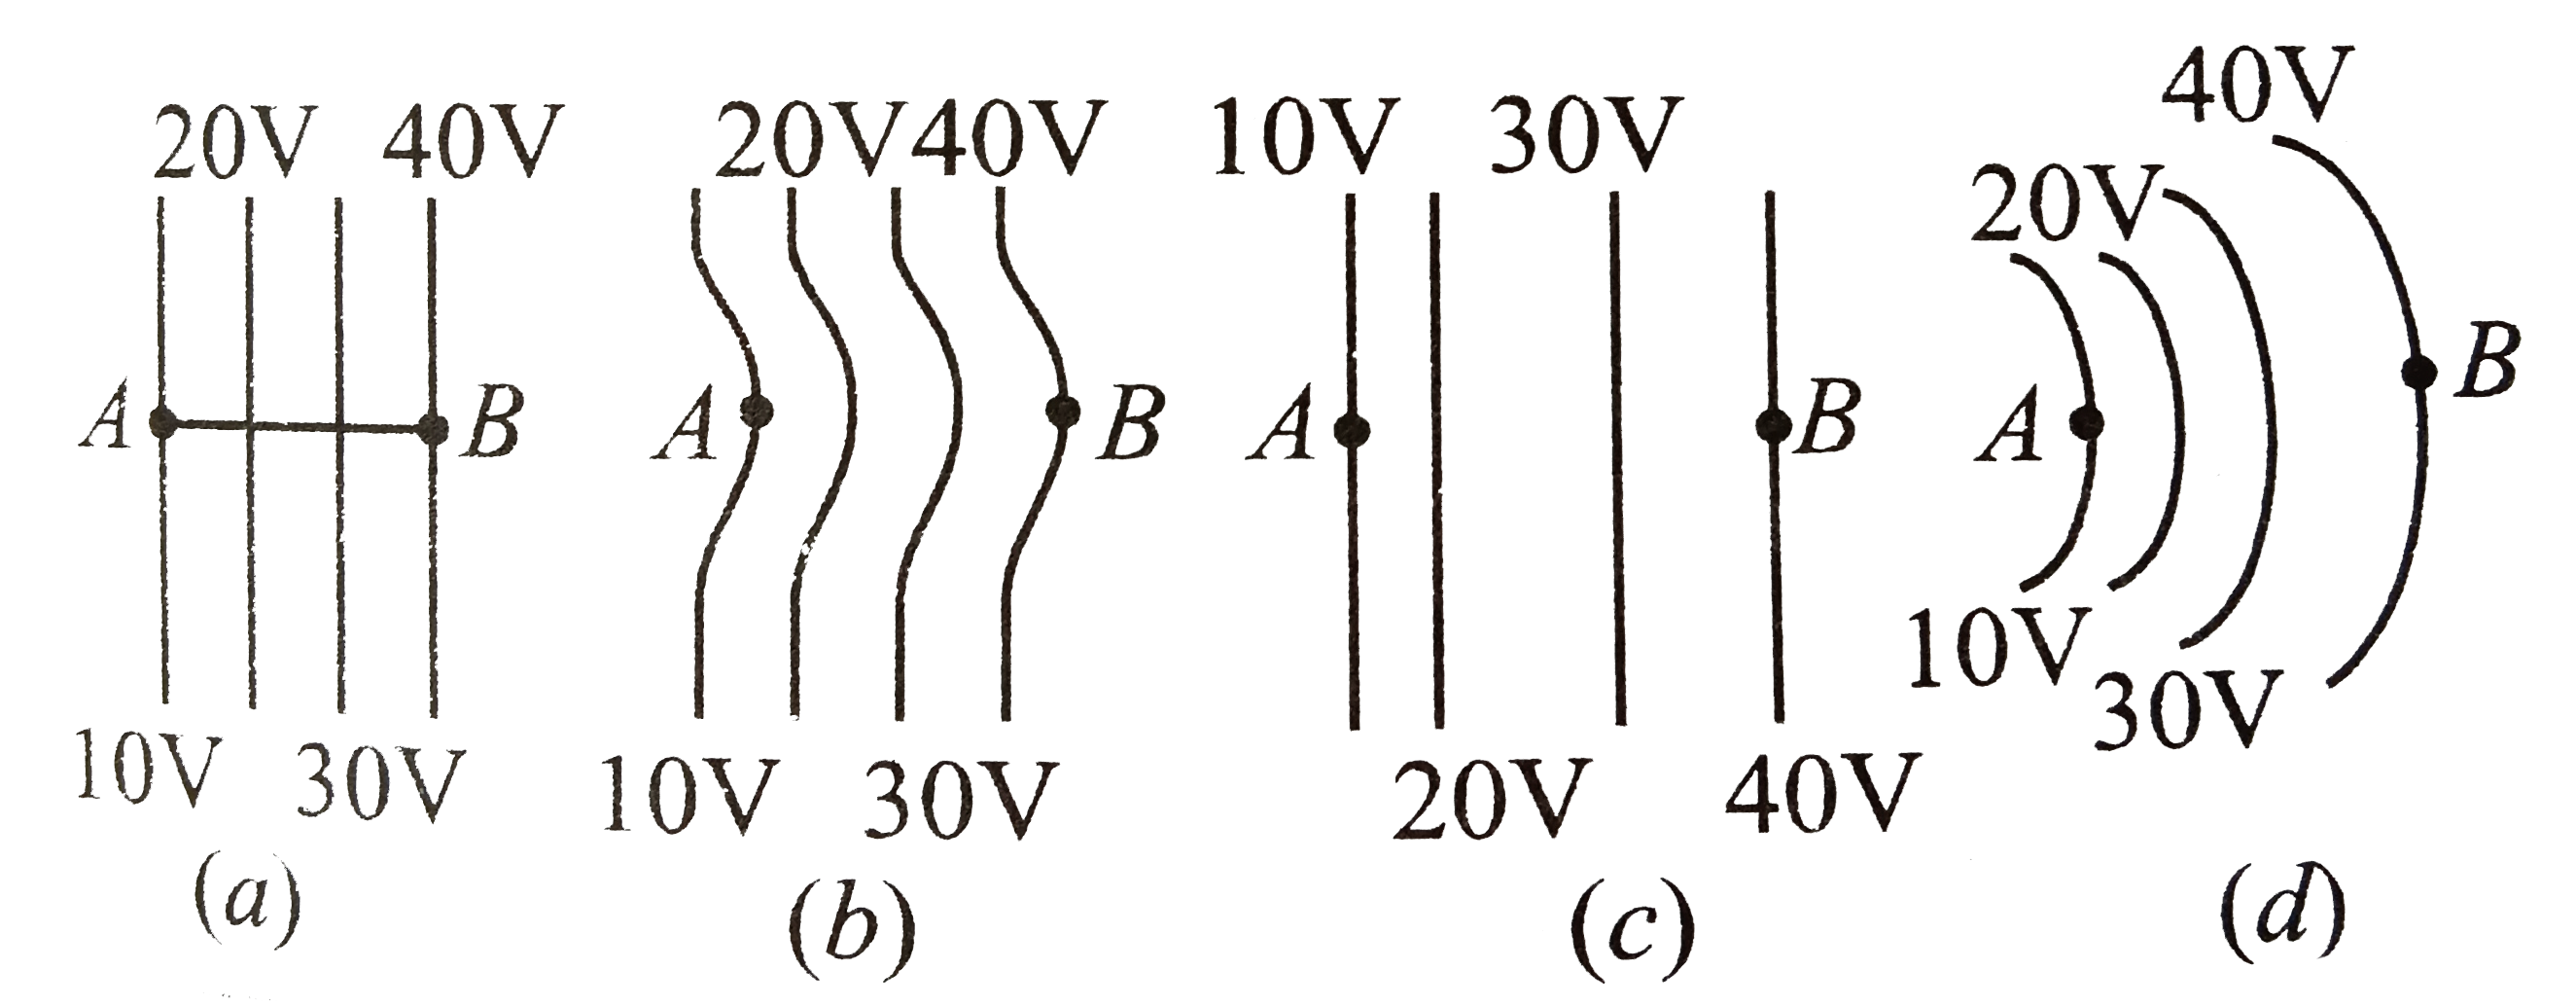
The diagrams below show region of equipotentials.
 AMaximum work is required to move q in figurec (c ).BIn all the four cases, the work doen is the same.CMinimum work is required to move q in figurec (a).DMaximum work is required to move q in figurec (b ).
 - Question 3 - Select One
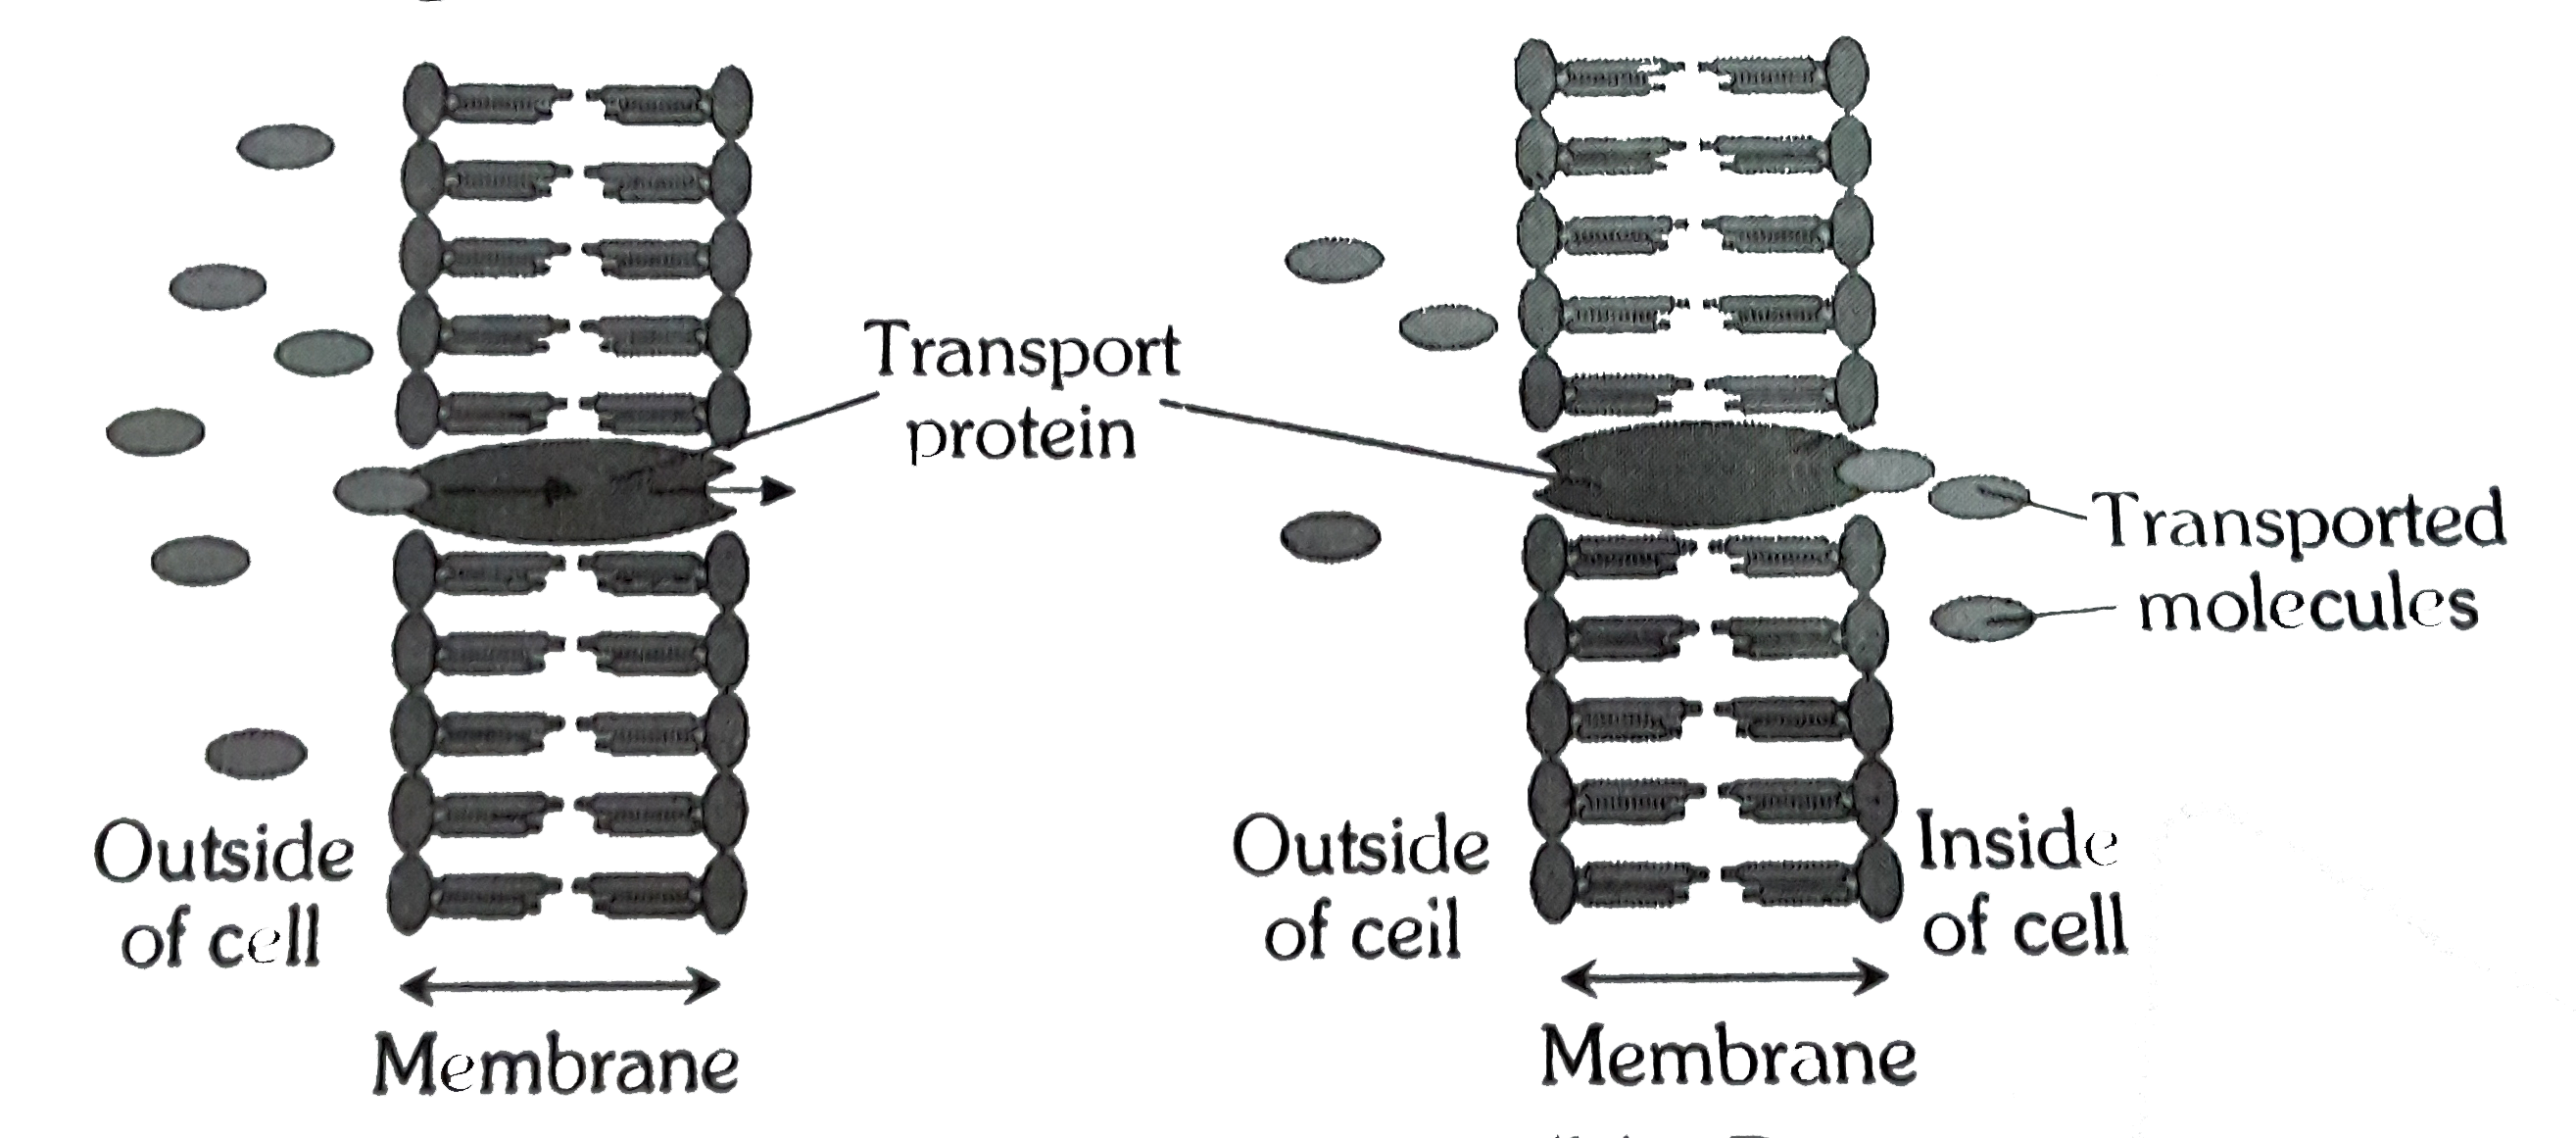
The given diagram shows the transportation of materials by
 ASecondary active transportBPrimary active transportCFacilitated diffusionDSimple diffusion
Which one occurs at same trophic level
View SolutionWhich of the following may accumulate at different trophic levels?
View SolutionWhich of the following organisms and trophic levels is mismatched?
View SolutionThe flow of energy along various trophic levels of an ecosystem is :
View SolutionWhich of the following organisms and trophic levels is mismatched?
View Solution

