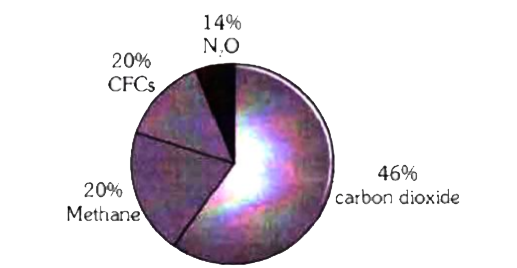
Which of the following figures shows correct relative contribution of greenhouse gases to global warming?
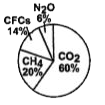

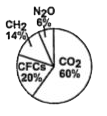
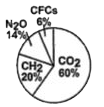
The correct Answer is:A
Step by step video, text & image solution for Which of the following figures shows correct relative contribution of greenhouse gases to global warming? by Biology experts to help you in doubts & scoring excellent marks in Class 12 exams.
Similar Questions
Knowledge Check
- Question 1 - Select One
Select the correct option for A, B , C and D given in the figure with respect to the relative contribution of various greenhouse gases to global warming.
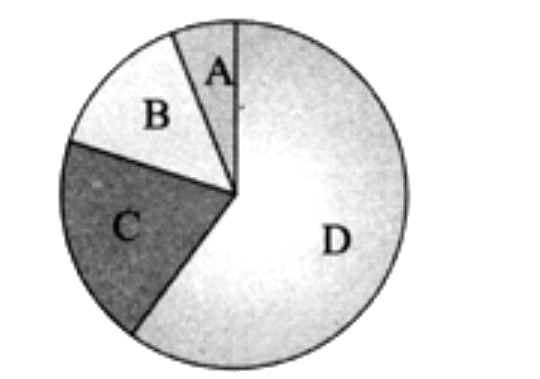 A(A−CO2),(B−CFCs),(C−CH4),(D−NO2)B(A−NO2),(B−CFCs),(C−CH4),(D−CO2)C(A−NO2),(B−CH4),(C−CFCs),(D−CO2)D(A−CH4),(B−CFCs),(C−NO2),(D−CO2)
 - Question 2 - Select One
Select the correct option respectively w.r.t. A, B, C and D in the given figure of relative contribution of various greenhouse gases to global warming.
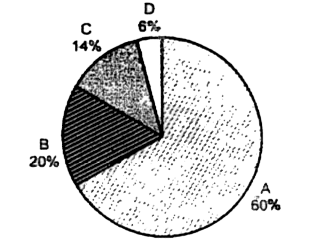 ACarbon dioxide, CFCs, methane, N2OBCarbon dioxide, methane, CFCs, N2OCCarbon dioxide, N2O, CFCs, methaneDCarbon dioxide, CFCs, N2O, methane
 - Question 3 - Select One
Contribution of methane to global warming is:
A6%B14%C20%D30%
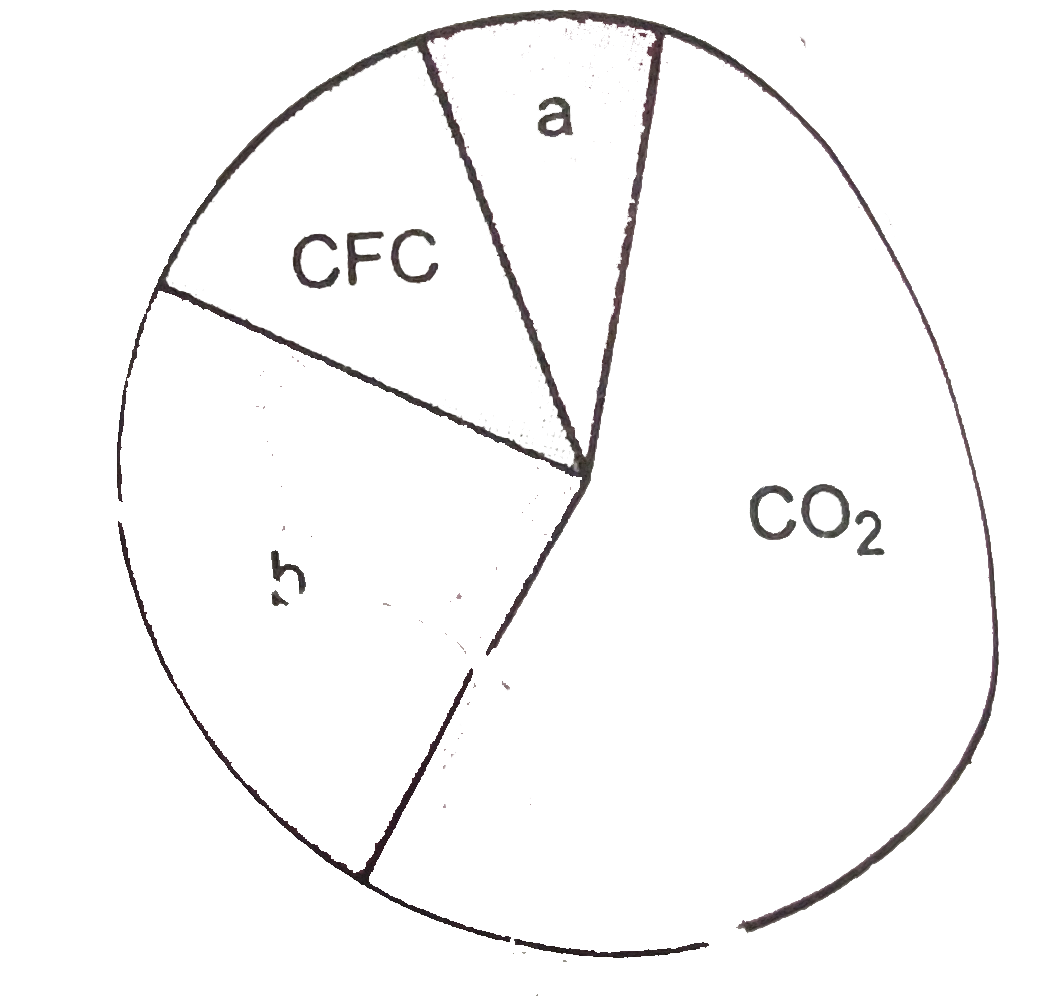
The figure shows relative contributions of various green house gases to the total global warming.
(i) Name the gases (a) and (b)
(ii) Explain how increase in green-house gases in earth's atmosphere leads to rise in sea level?
 View Solution
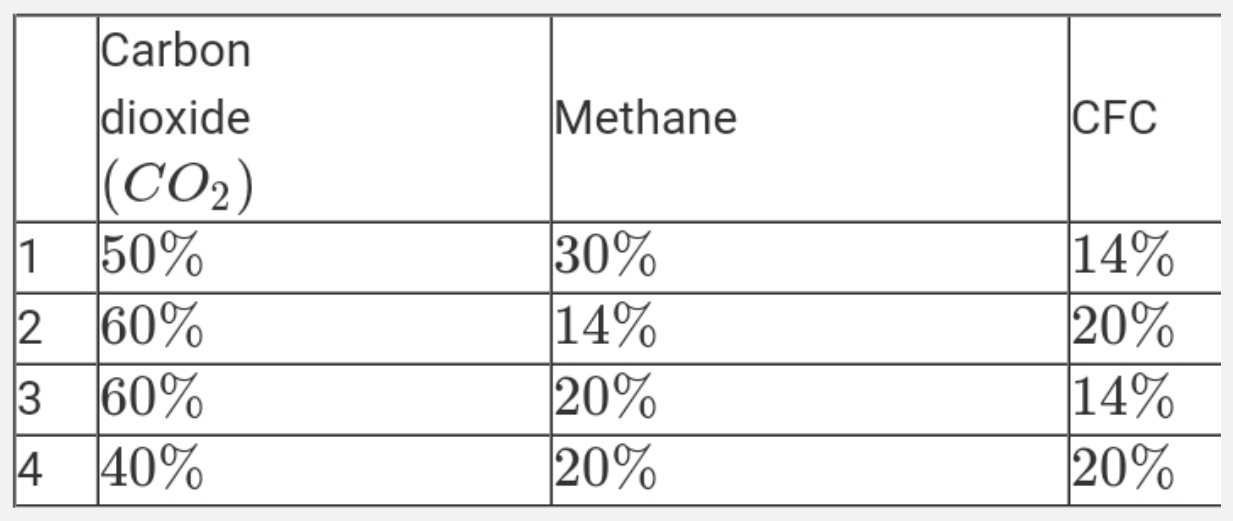
Select the correct option by identifying the relative contribution of various greenhouse gases to the total global warming.
 View Solution
Greenhouse Effect and Global Warming
View SolutionThe two gases making highest relative contribution to the greenhouse gases are:
View SolutionThe two gases making highest relative contribution to the greenhouse gases are:
View Solution


