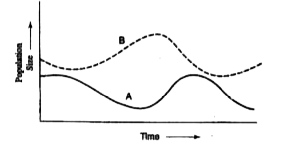
If line A in the diagram represents a population of hawks in a community, then what would most likely be represented by line B?
A
the dominant trees in that community
B
a population with which the hawks have a mutu• alistic relationship
C
variations in the numbers of producers in that community
D
a population on which the hawks prey
Text Solution
The correct Answer is:D
|
Similar Questions
Knowledge Check
Diagram A and B represents?
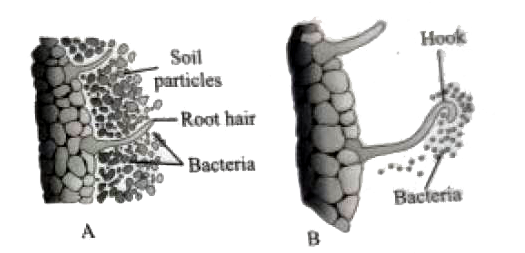 AA-Bacteria get modified into rod-shaped bacteroidsBB-Successful infection of root hairCB-Successful infection of root hairDB-Bacterial division occurs
In the given Venn diagram, the ‘rectangle’ represents ‘ladies of a club’, the ‘triangle’ represents ‘like to dance’, the ‘circle’ represents ‘like to sing’ and the ‘pentagon’ represents ‘like to mimic’. The numbers given in the diagram represents the number of persons in that particular category.
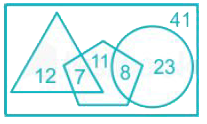
How many ladies of the club NEITHER like to dance NOR like to mimic?A23B26C64D72If 'A' represents the dominant gene and 'a' represents its recessive allele, which of the following would be the most likely result in the first generation offspring when Aa is crossed with aa?
AAll will exhibit dominant phenotype.BAll will exhibit recessive phenotype.CDominant and recessive phenotypes will be 50% each.DDominant phenotype will be 75%.
Represent −7 on number line
View SolutionRepresent 8 and −2 on a number line.
View SolutionRepresent 5 and −2 on a number line.
View SolutionThe diagram represents two inequation A and B on real number lines:

Write down A and B in set builder notation.
View SolutionIf 'A' represents the dominant gene and 'a' represents its recessive allele, which of the following would be the most likely result in the first generation offspring when Aa is crossed with aa?
View Solution

