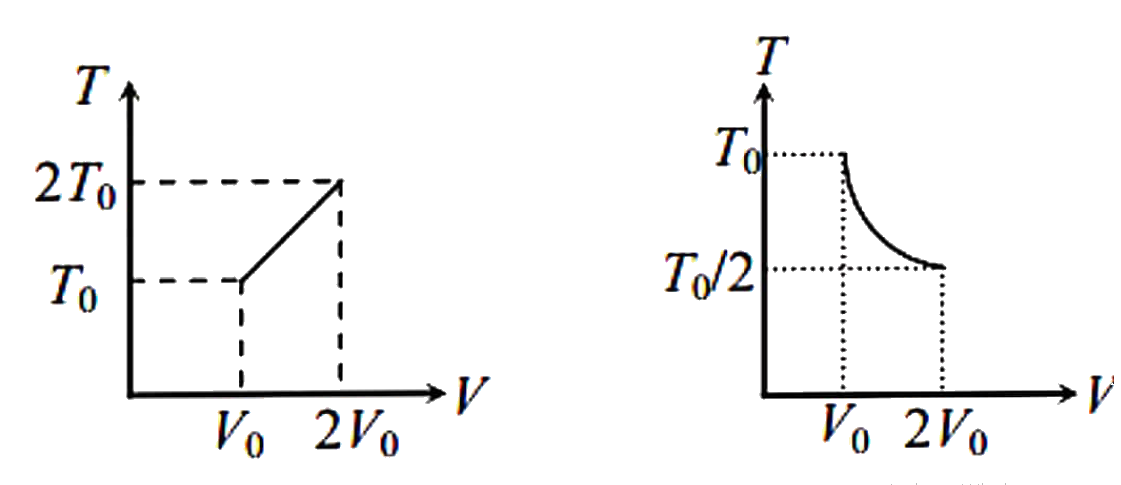
Temperature and volume curves are drawn for two thermodynamic processes. For the first process, it is a straight line and for the second, it is a rectangular hyperbola. The ratio of work done in the first process to the work done in the second process is
A
B
C
D
3:2
Video Solution
Text Solution
The correct Answer is:A
|
Answer
Step by step video & image solution for Temperature and volume curves are drawn for two thermodynamic processes. For the first process, it is a straight line and for the second, it is a rectangular hyperbola. The ratio of work done in the first process to the work done in the second process is by Physics experts to help you in doubts & scoring excellent marks in Class 12 exams.
Updated on:21/07/2023Similar Questions
Knowledge Check
The work done in adiabatic process is given by
AnR(T1)−T2γBnR(T1)−T2γ−1C(nR(T1)−T2)RDγ(T1)−T2RnAn ideal gas system undergoes an isothermal process, then the work done during the process is
AnRTln(V2V1)BnRTln(V1V2)C2nRTln(V2V1)D2nRTln(V1V2)
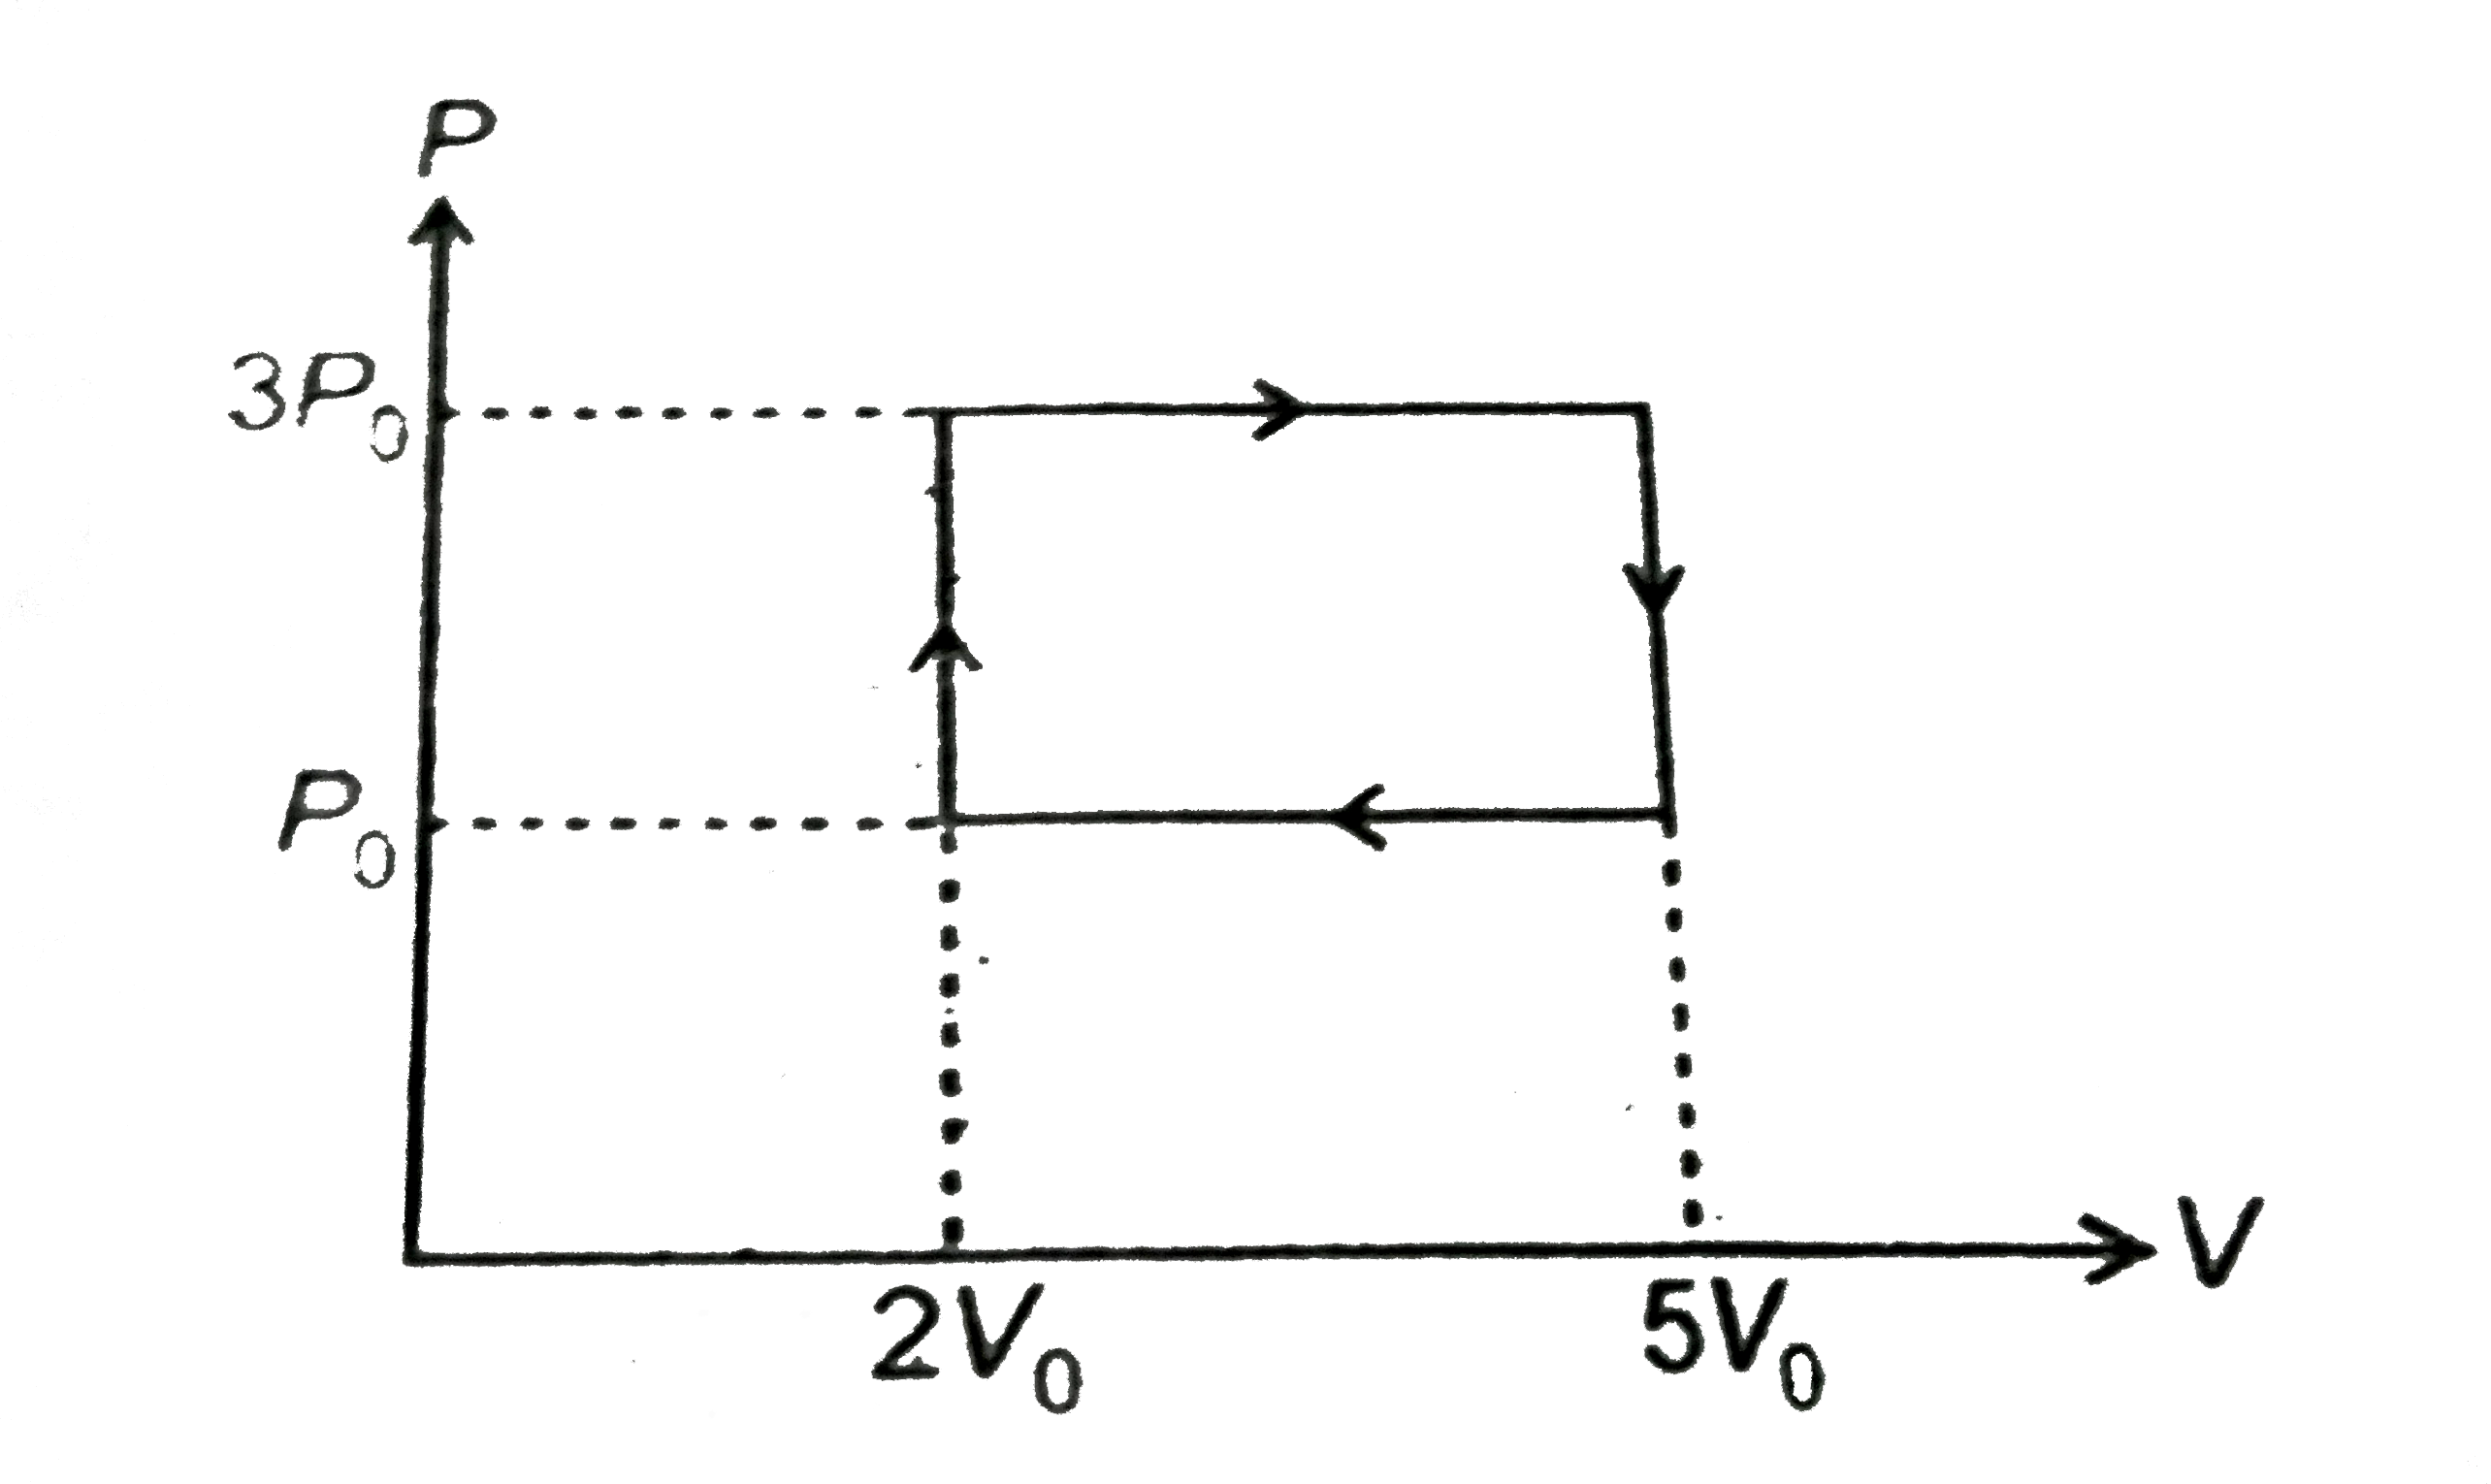
Work done in given cyclic process is
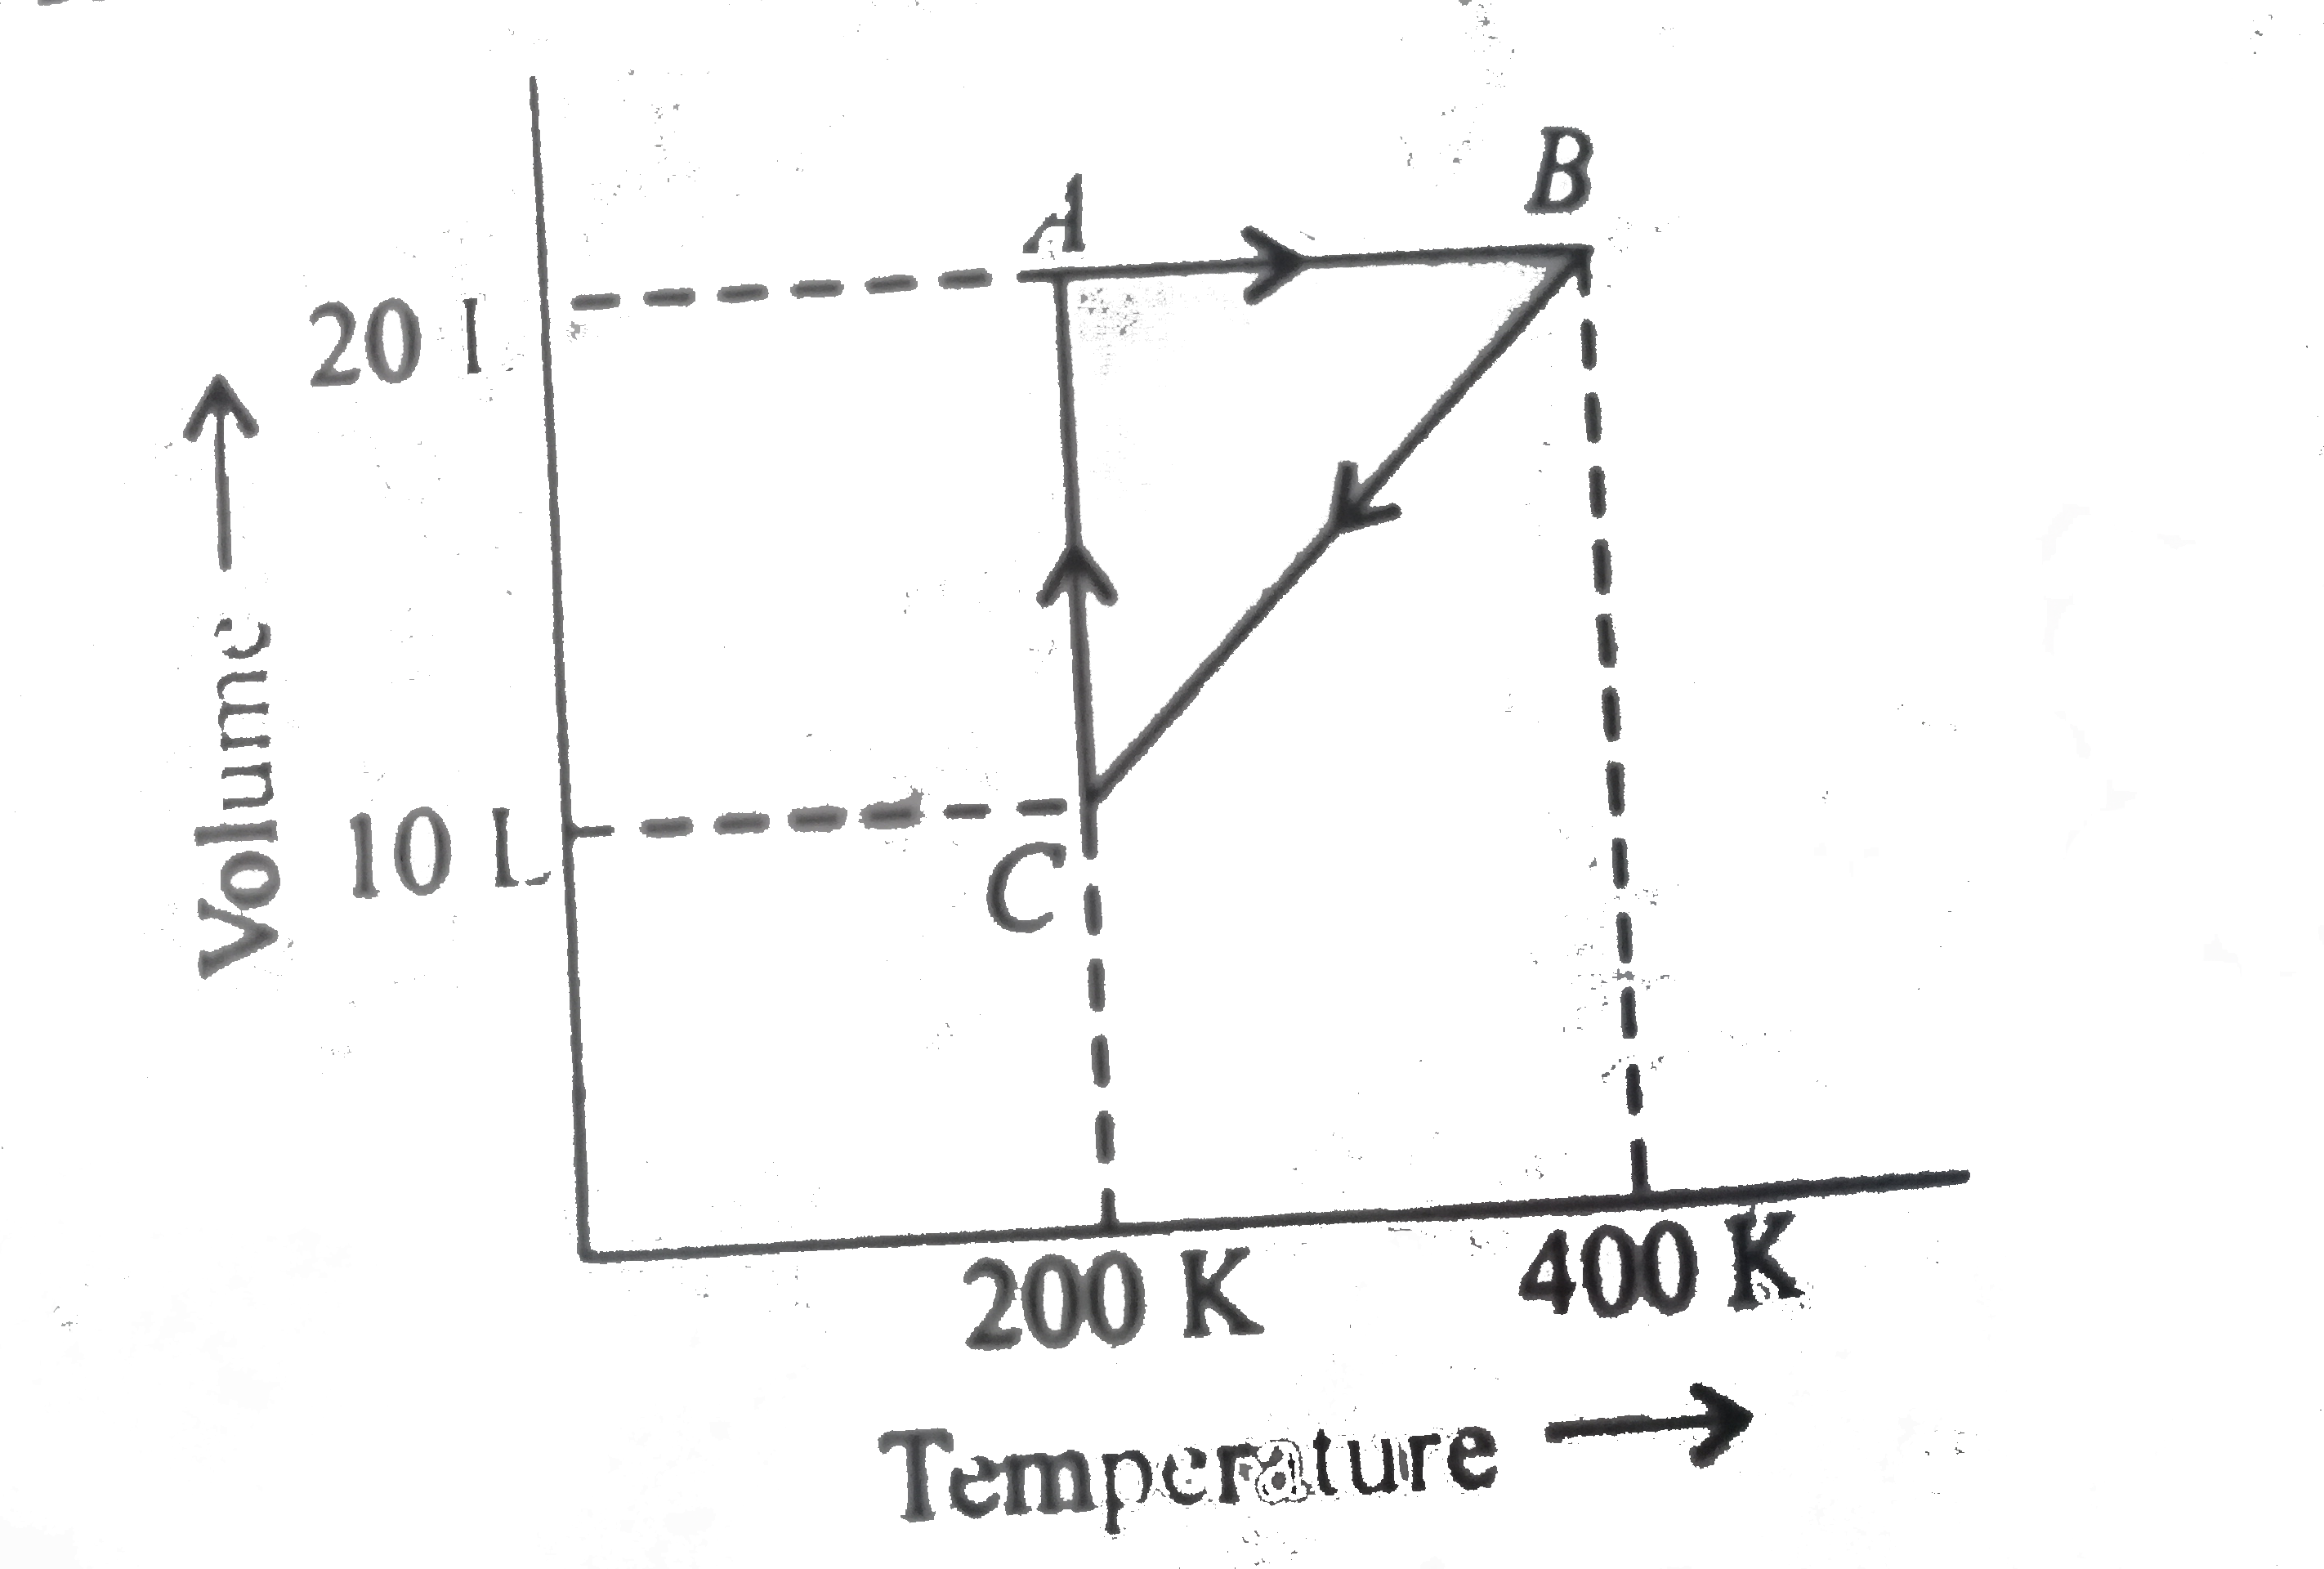
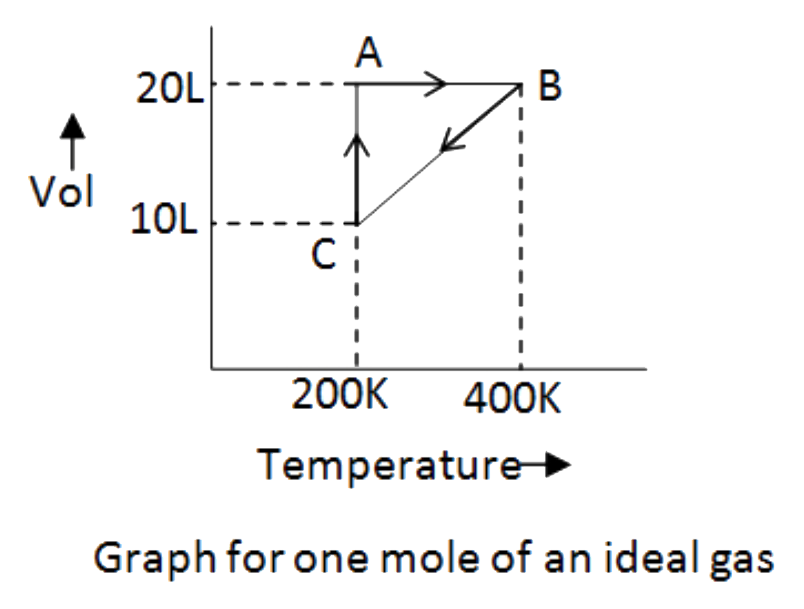
View SolutionFind work done in the irreversible process C→A.
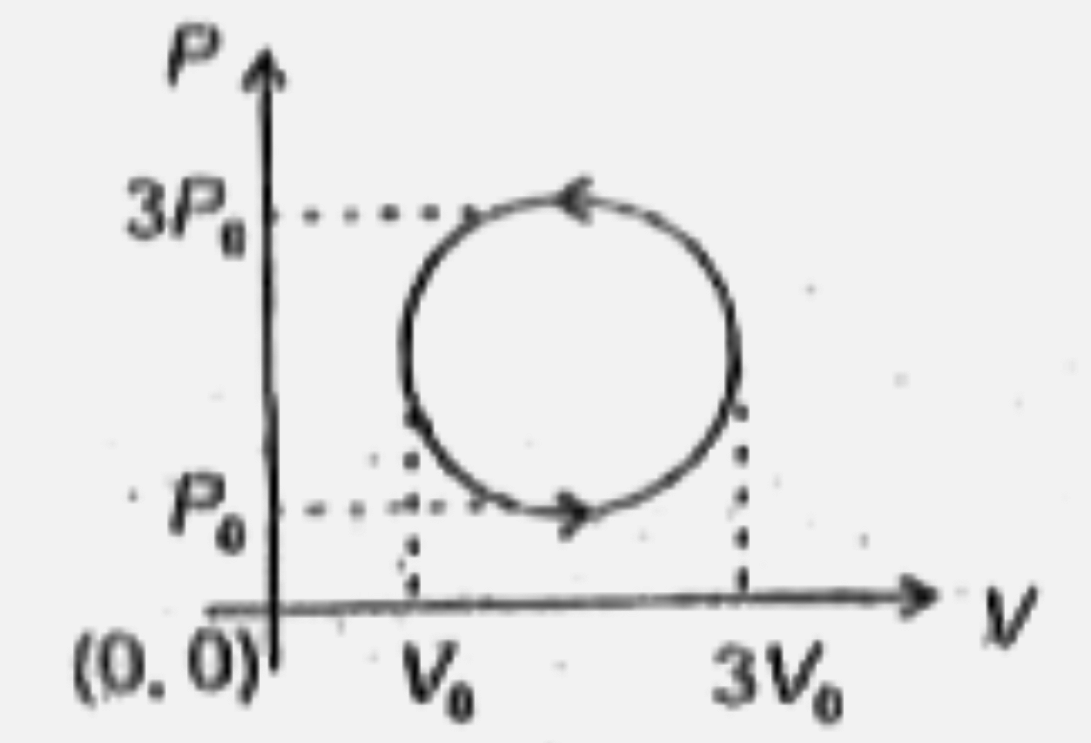
View SolutionWork done in the cyclic process shown in figure is
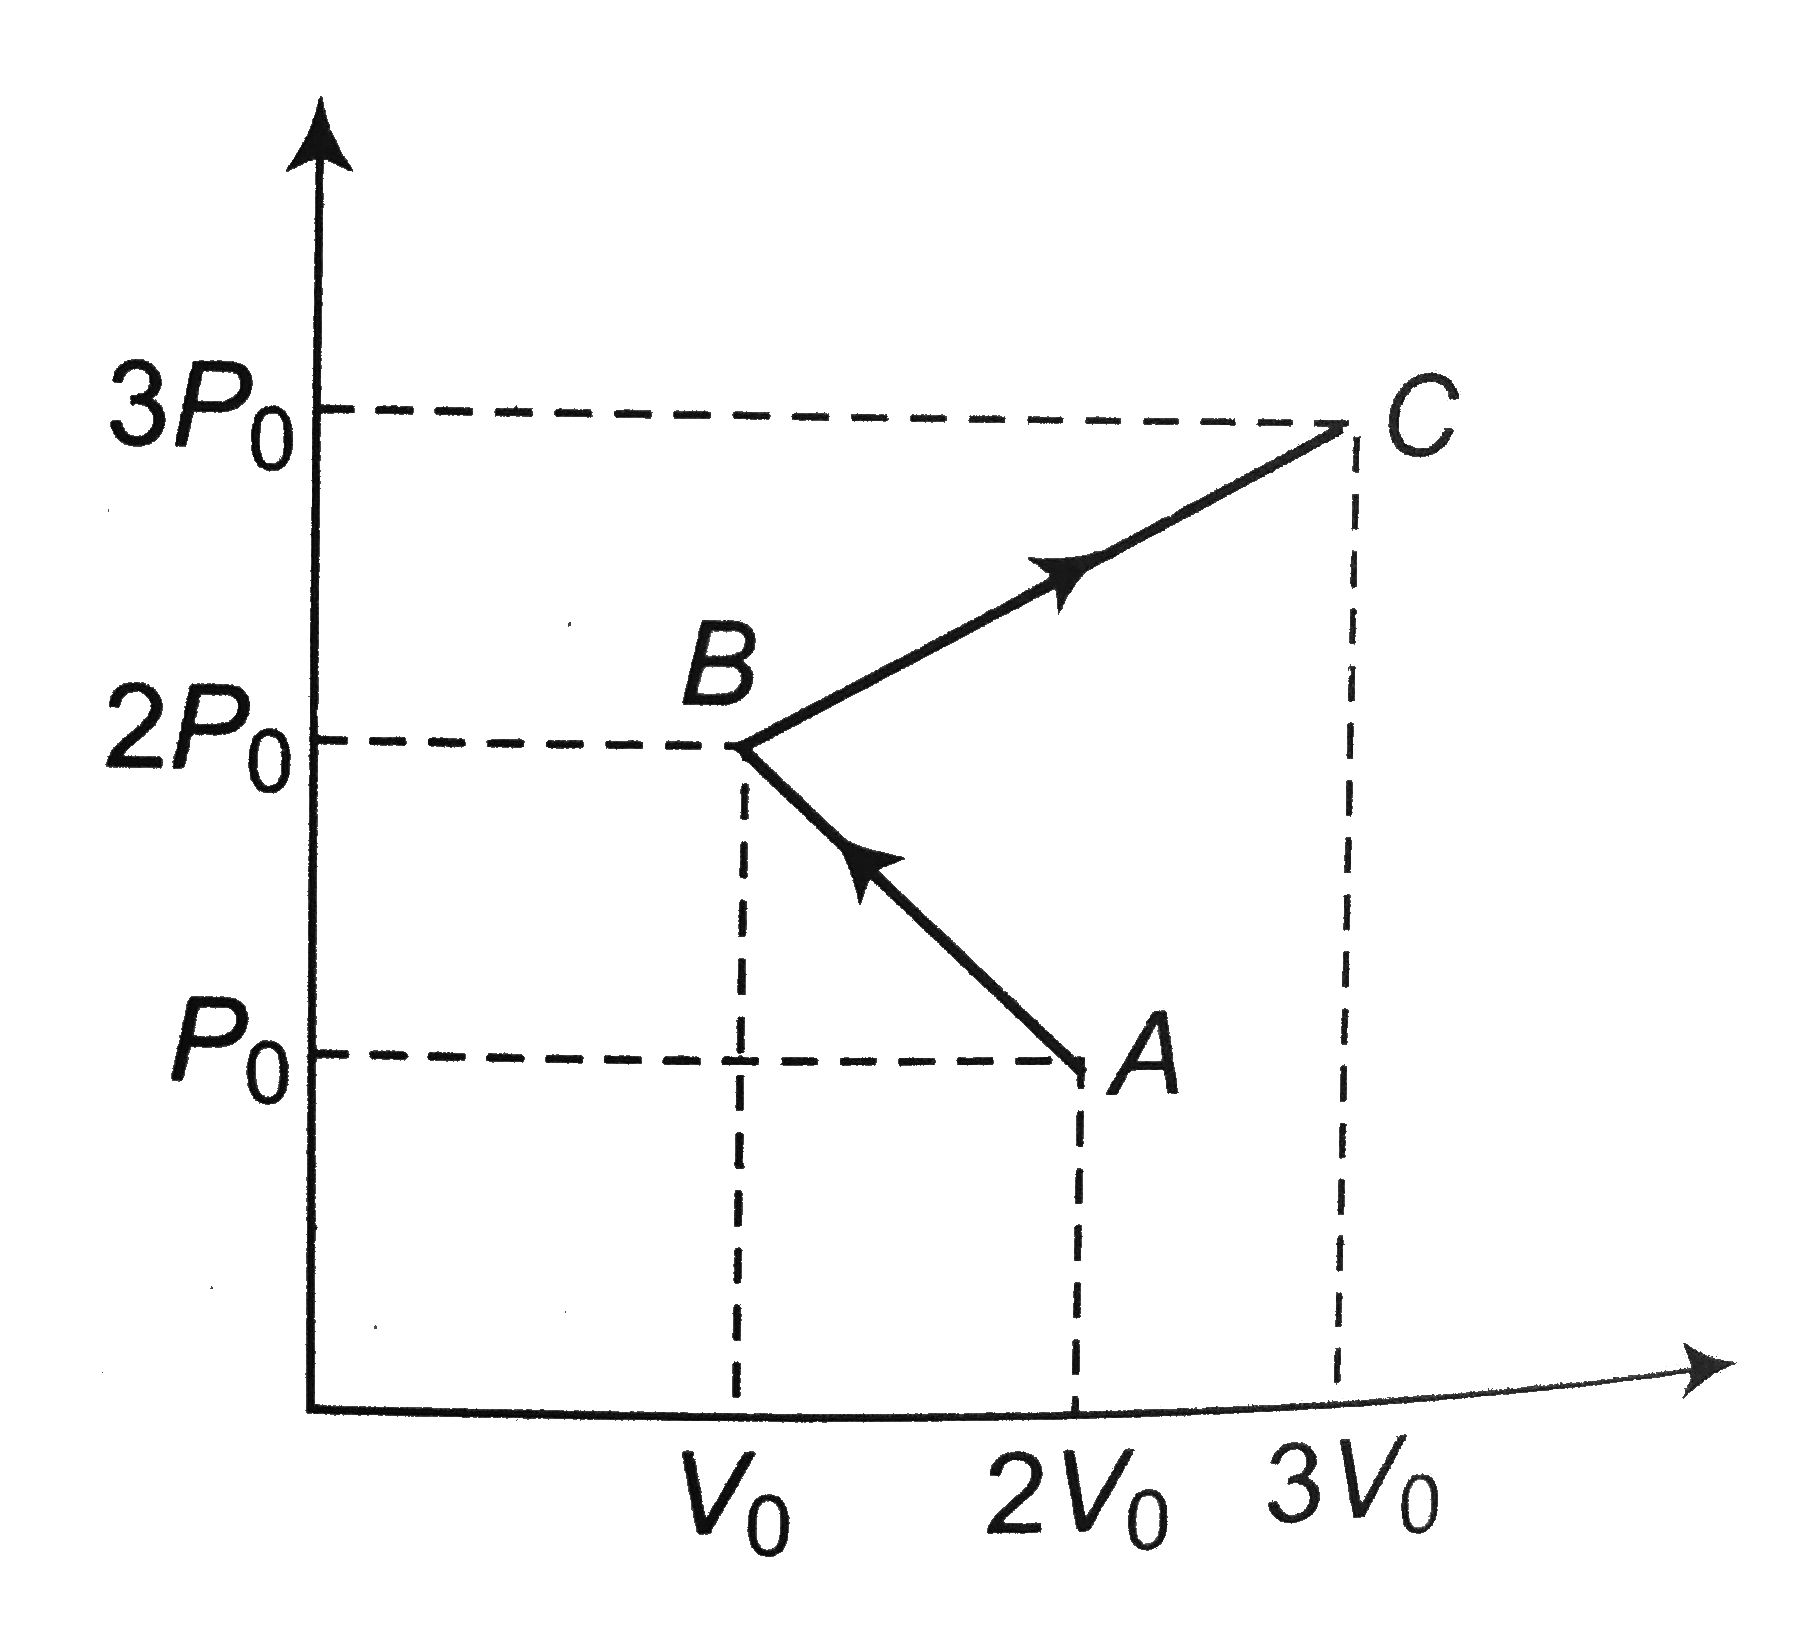
View SolutionFind the work done by the gas in the process ABC.
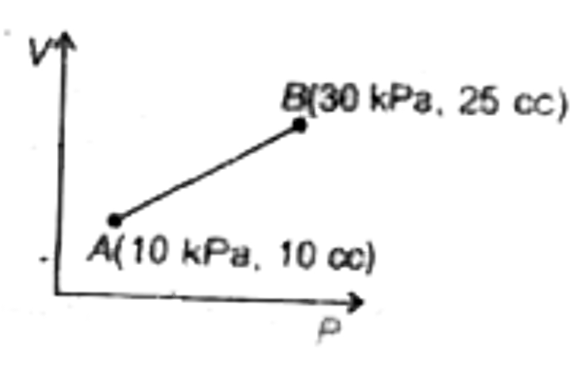
View SolutionWork done for the process shownin the figure is
View SolutionIn a cyclic process, work done by the system is
View Solution

