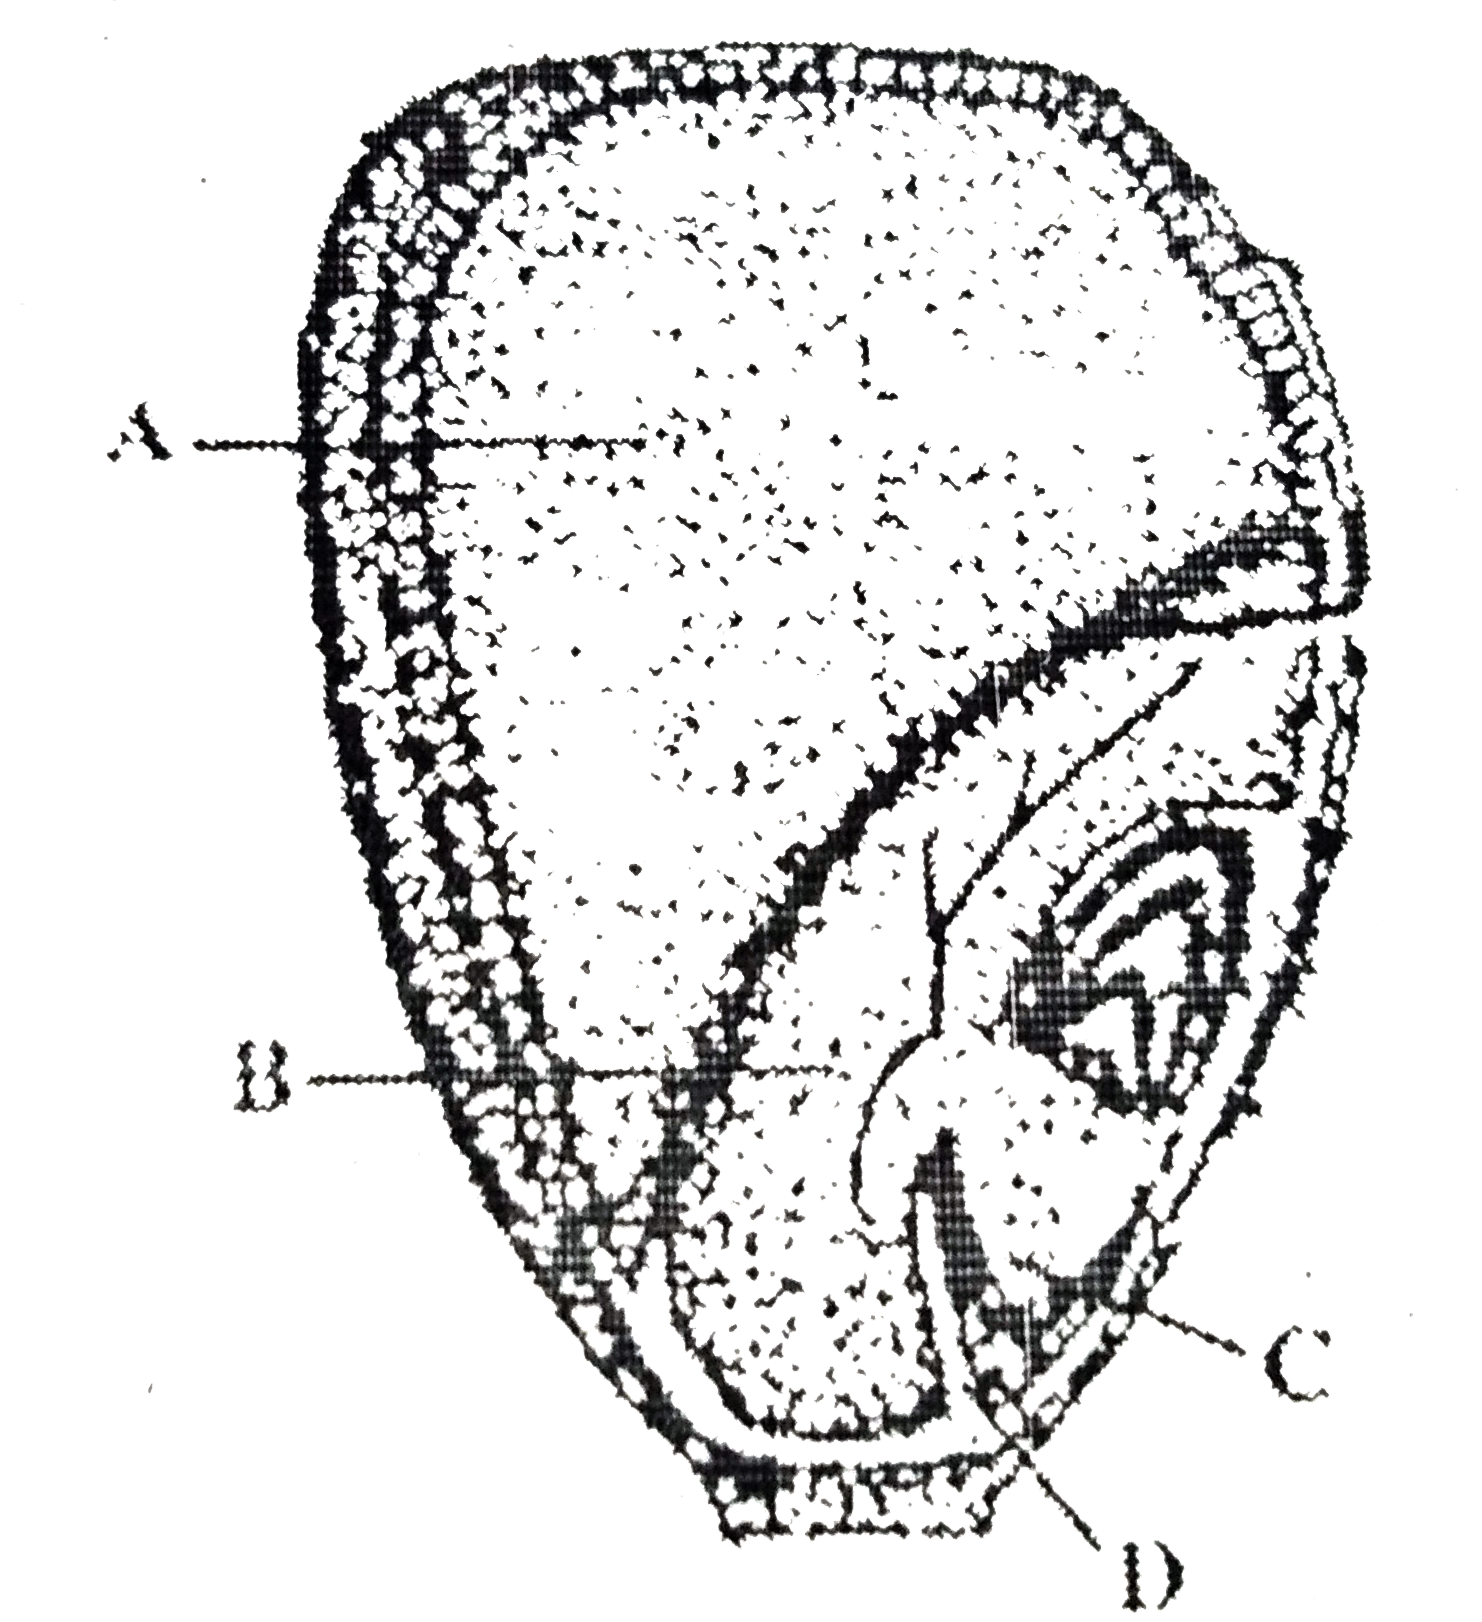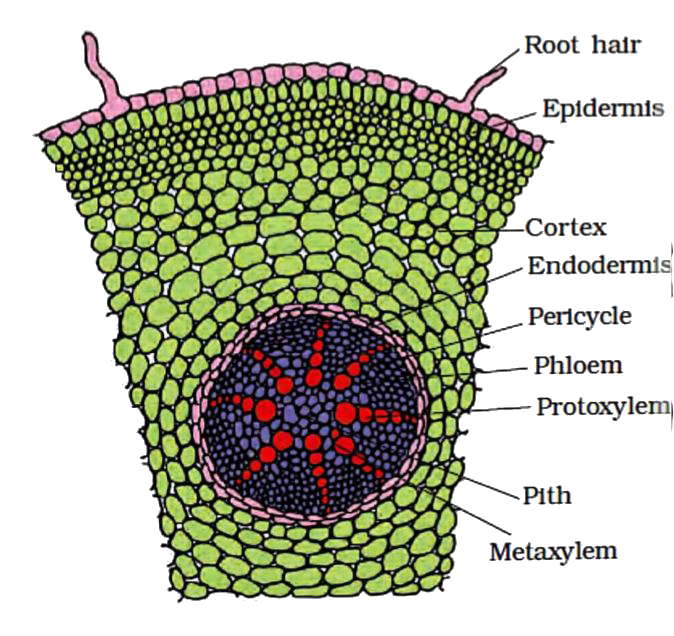
The given figure shows T.S of
A
Dicot root
B
Monocot root
C
Secondary growth in dicot root
D
Secondary growth in monocot root
Video Solution
Text Solution
The correct Answer is:B
|
Answer
Step by step video & image solution for The given figure shows T.S of by Biology experts to help you in doubts & scoring excellent marks in Class 12 exams.
Updated on:21/07/2023Similar Questions
Knowledge Check
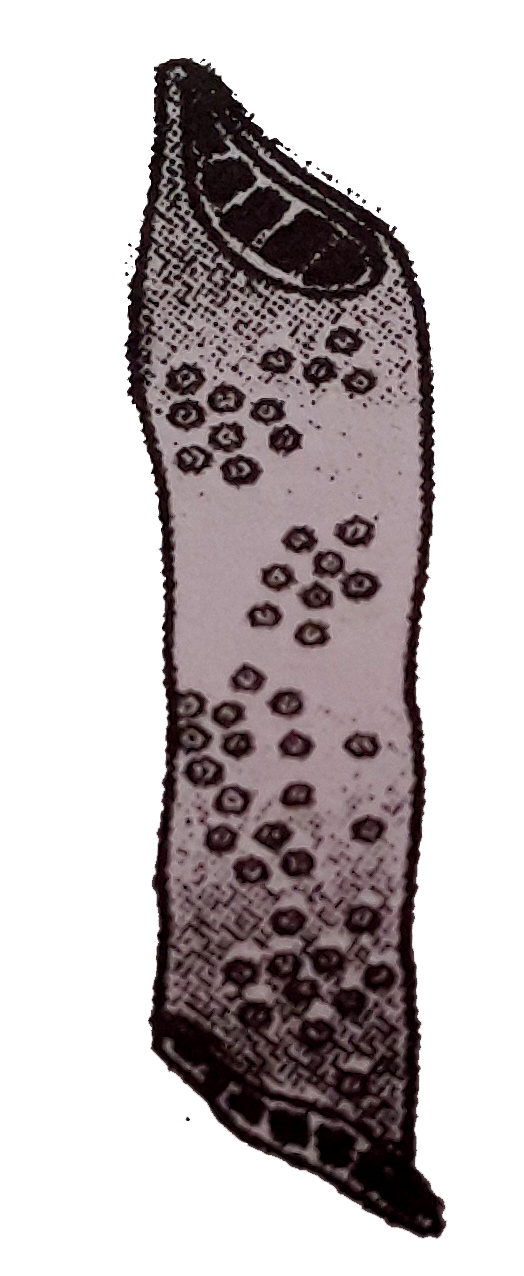
The given figure shows which of the following cells?Acompanion cellBsieve tube elementCXylem vesselDXylem tracheidWhat type of inflorescence does the given figure show ?
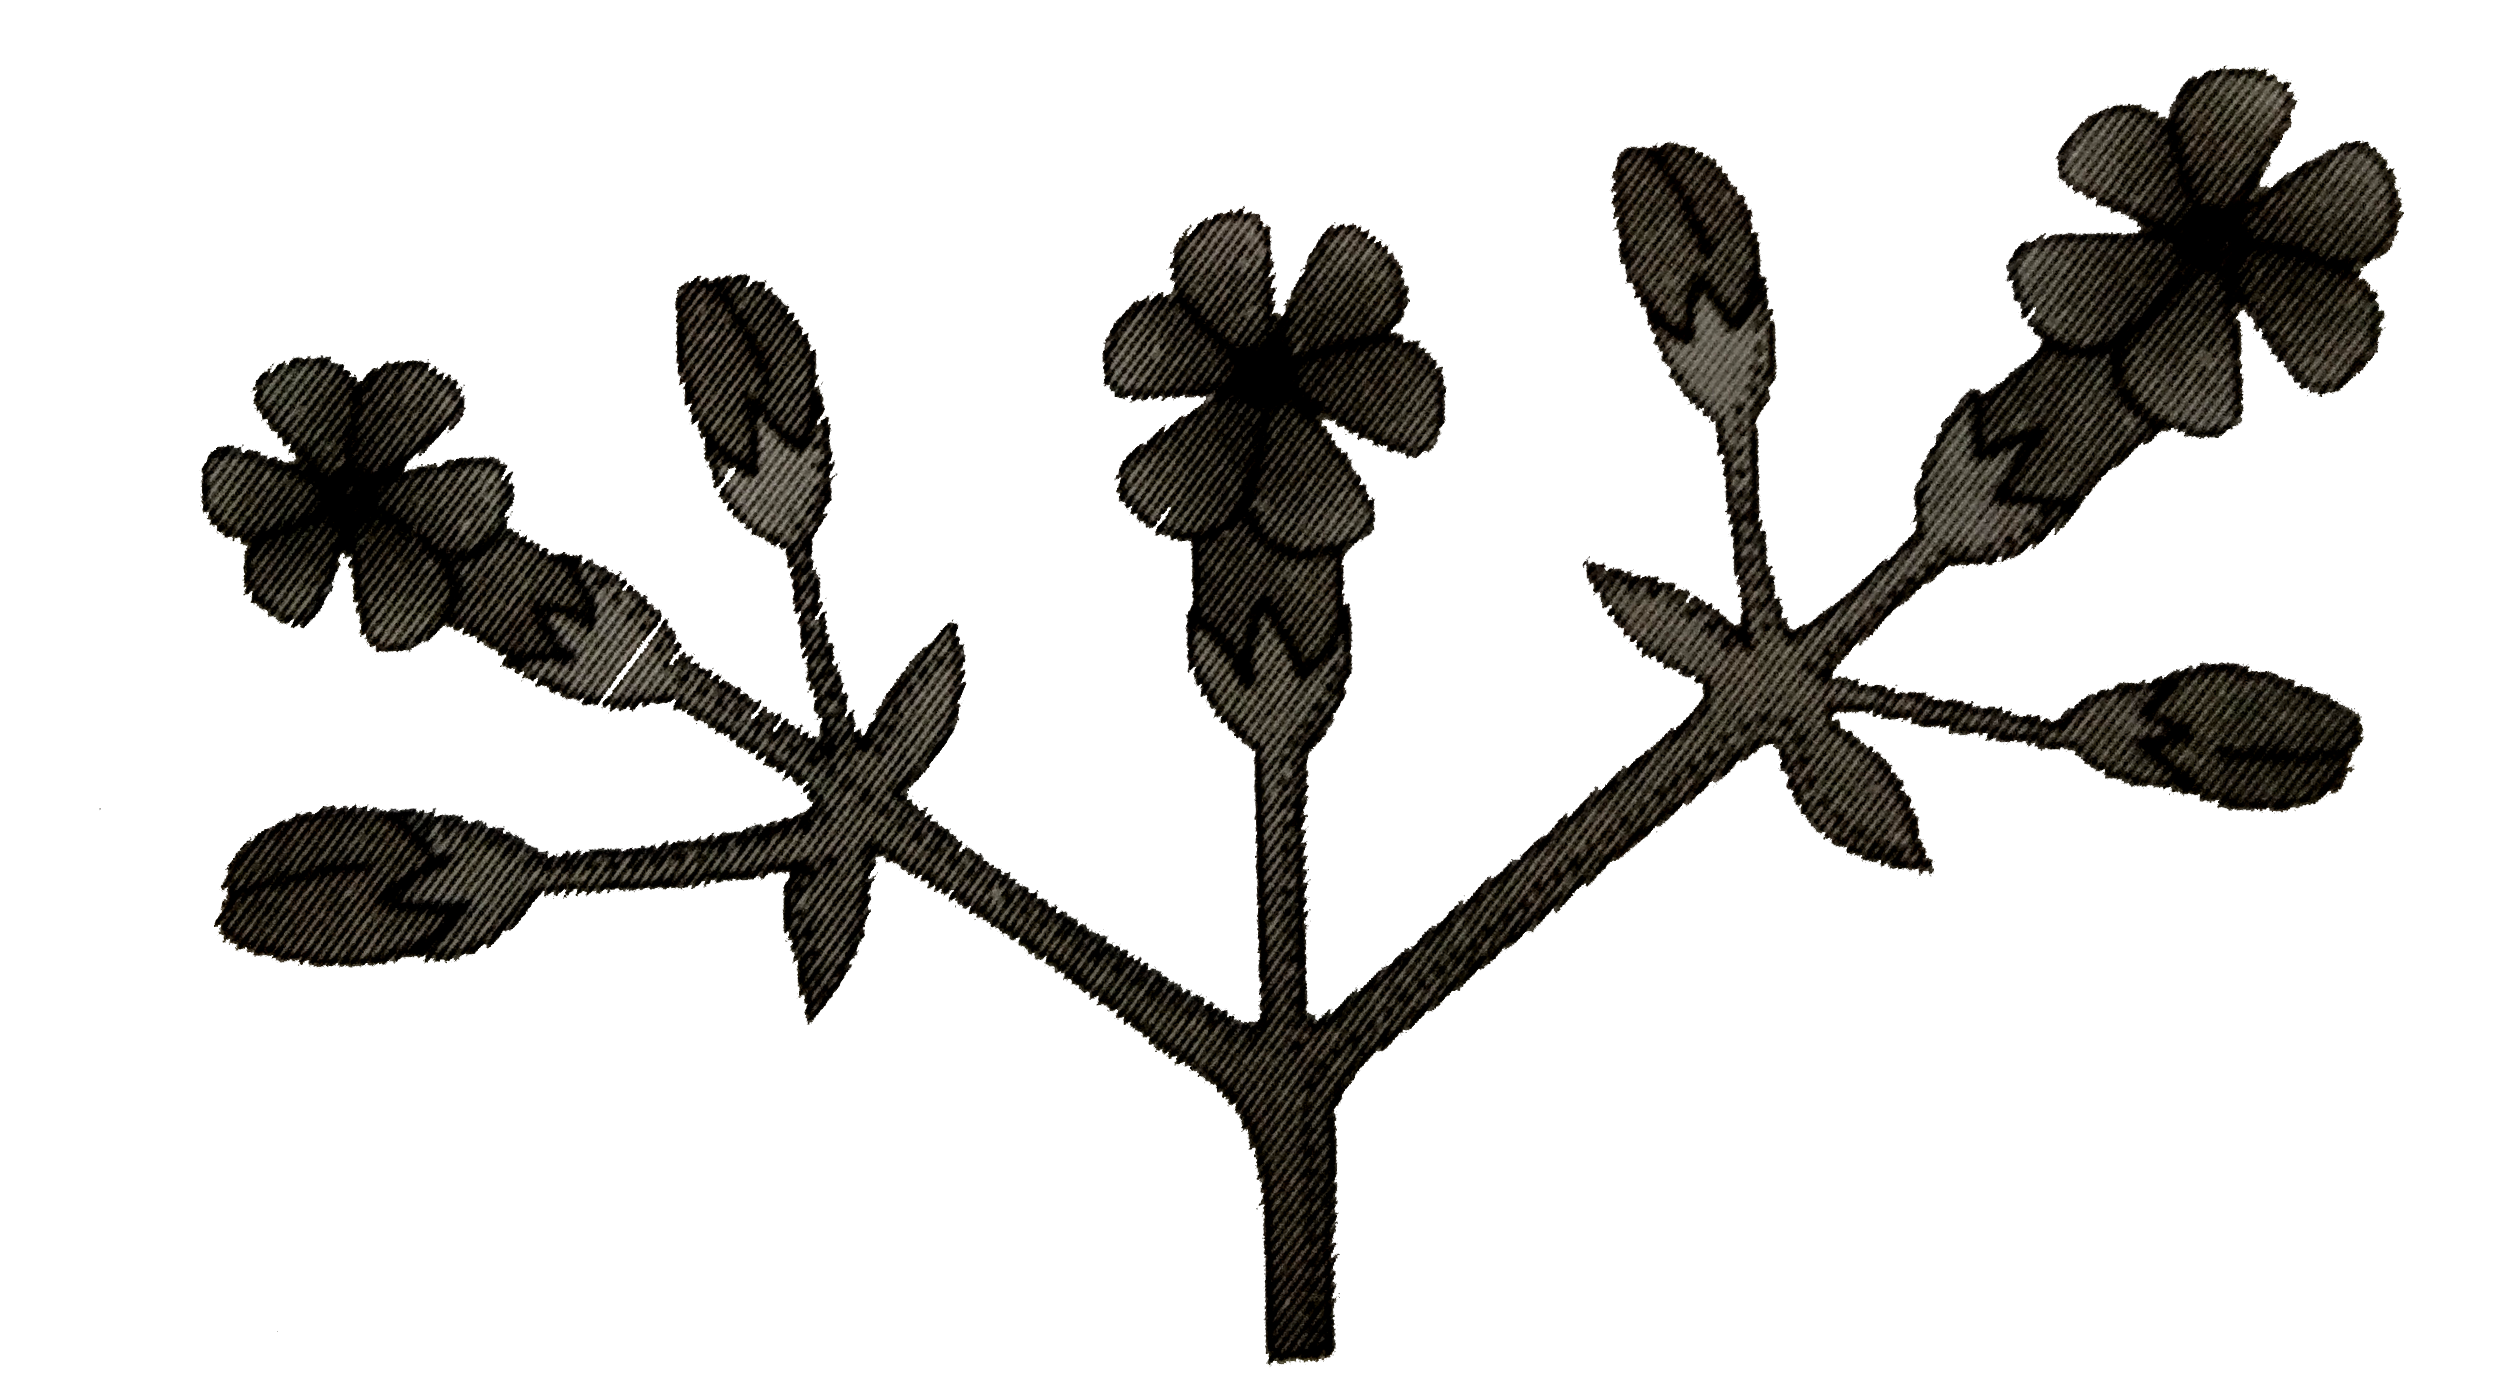 AUniparous cymeBBiparous cymeCMultiparousDRacemose
The given figure shows an example of
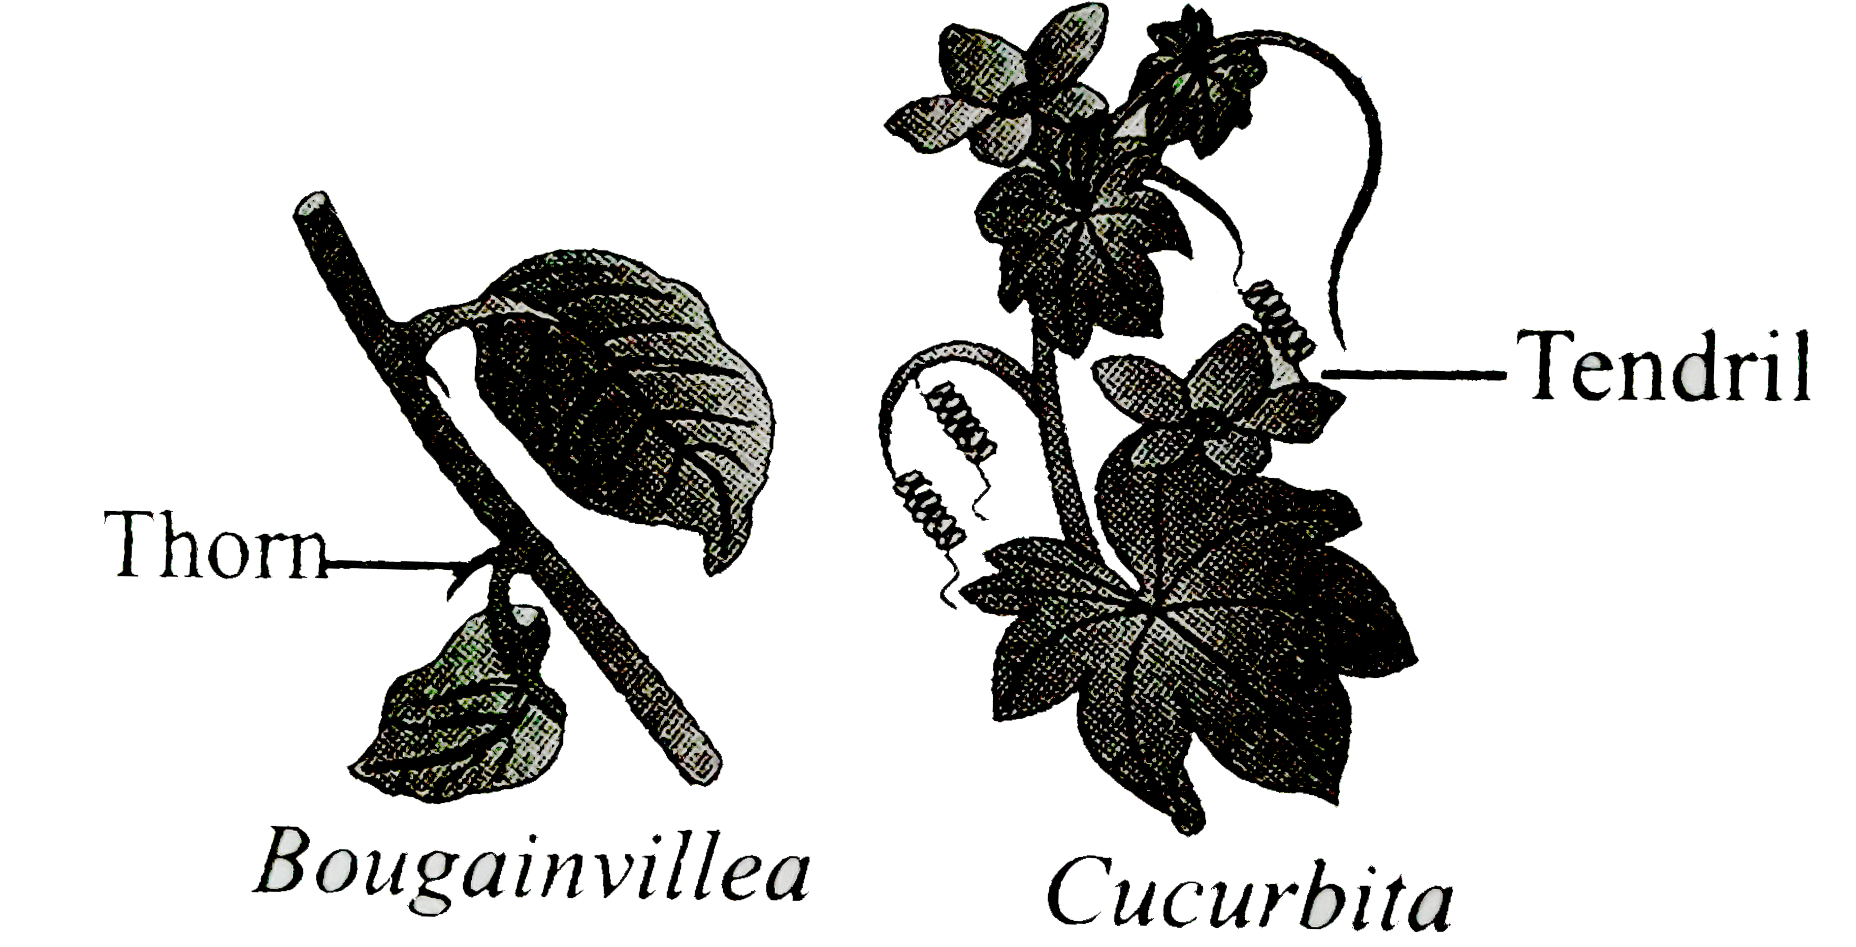 Ahomologous organsBconvergent evolutionCdivergent evolutionDboth a and c
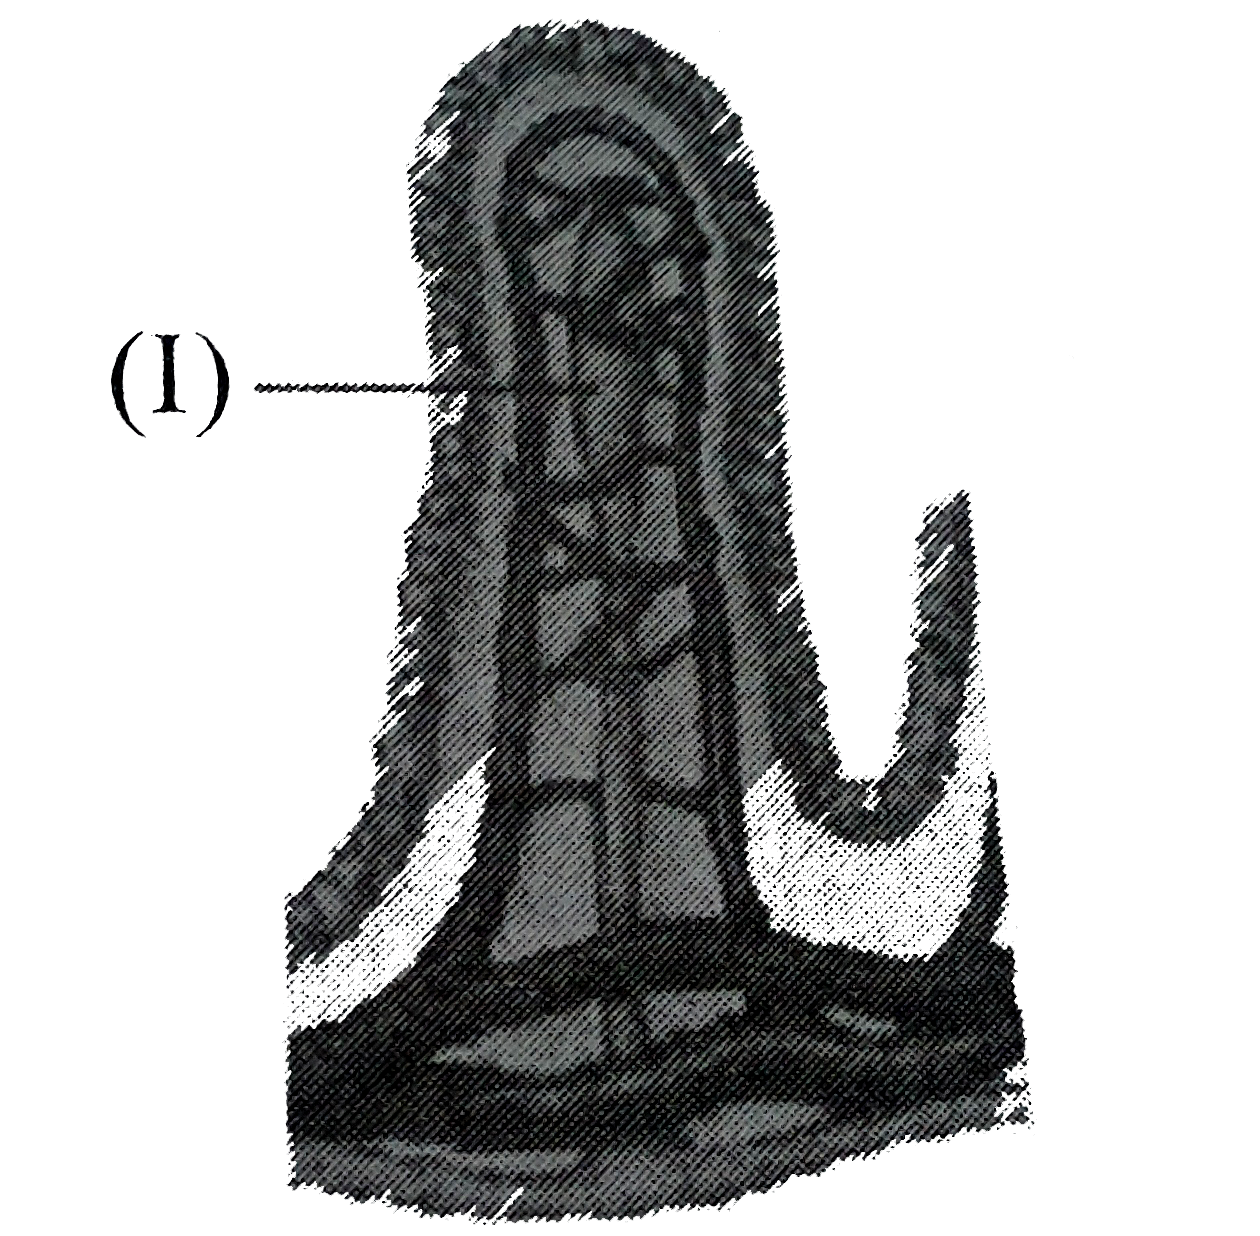
The given figure shows a section of small intestinal mucosa showing villi. What is the function of structure marked as I in the given figure ?
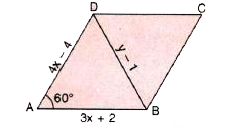
View SolutionThe given figure shows a rhombus ABCD. Find x and y
View SolutionThe given figure shows a square ABCD and an equilateral triangle ABP. Calculate:
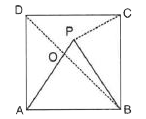
∠PCD
View SolutionThe given figure shows a square ABCD and an equilateral triangle ABP. Calculate:
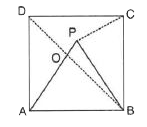
∠BPC
View SolutionThe given figure shows a square ABCD and an equilateral triangle ABP. Calculate:
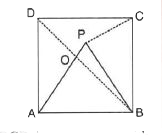
∠AOB
View Solution

