The plots of the extent of adsroption (x/m) Vs pressure at different temperature are as follows,
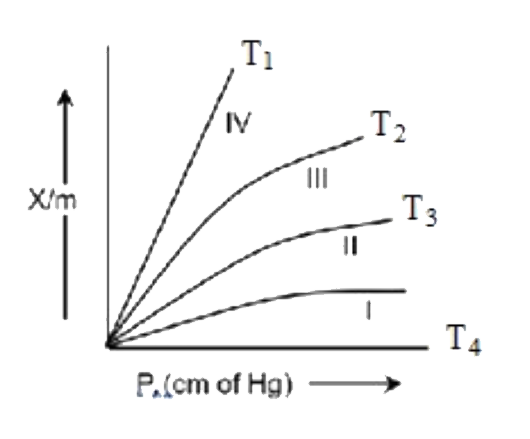
The correct order of increasing temp for curves I, II, III, IV are ,
T1>T2>T3>T4
T4>T3>T2>T1
T3>T2>T1>T4
can't be predicted
The correct Answer is:B
Step by step video & image solution for The plots of the extent of adsroption (x/m) Vs pressure at different temperature are as follows, The correct order of increasing temp for curves I, II, III, IV are , by Chemistry experts to help you in doubts & scoring excellent marks in Class 12 exams.
Updated on:21/07/2023Similar Questions
Compressibility factor (Z) is plotted against pressure at different temperature for same gas
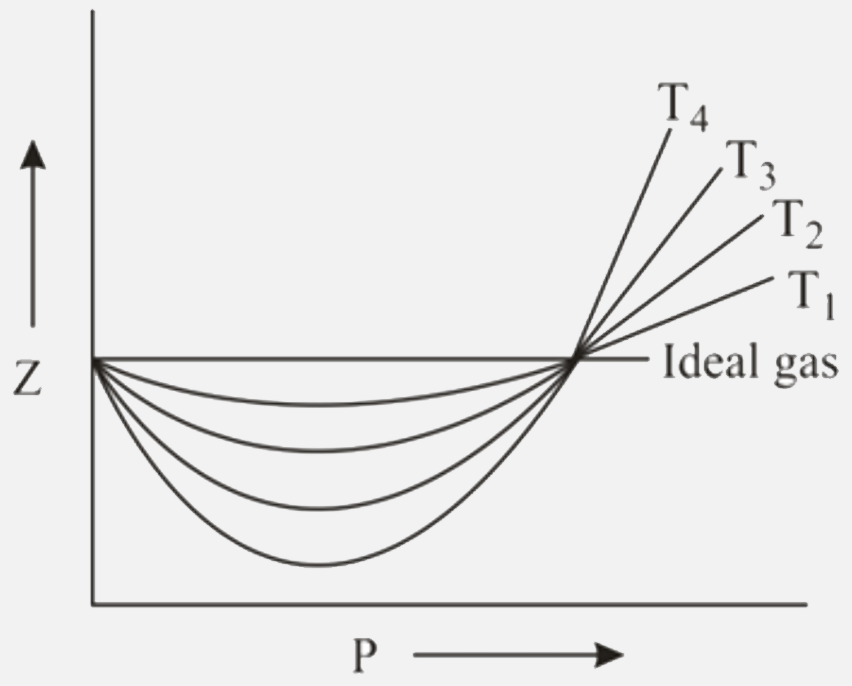
Which of the following is the correct order of temperature shown in the above plot ?
View SolutionThe variation of extent of adsorption with pressure at a given constant temperature is given in following figure
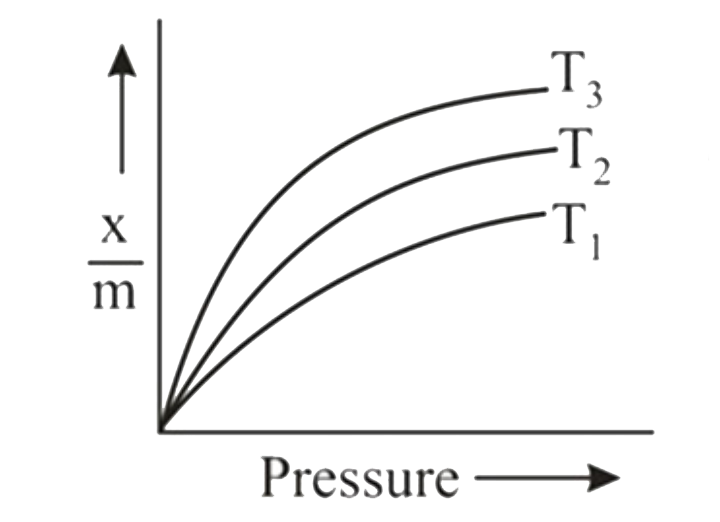
Which of the following relation between temperature of isotherms is correct ?
View SolutionIn the following sketch three constant pressure lines are plotted on T vs V plot, then which is the correct order of the pressure .

View SolutionThe correct order of increasing thermal stability of the given compound is
I. HF
II. HBr
III. HCl
IV. HI
View SolutionConsider the adsorption isotherm given below and interpret the variation in the extent of adsorption (xm) when
a. Temperature increased at constant pressure.
b. Pressure increases at constant temperature.
View SolutionThe decreasing order of acidic character of the following is:
(I)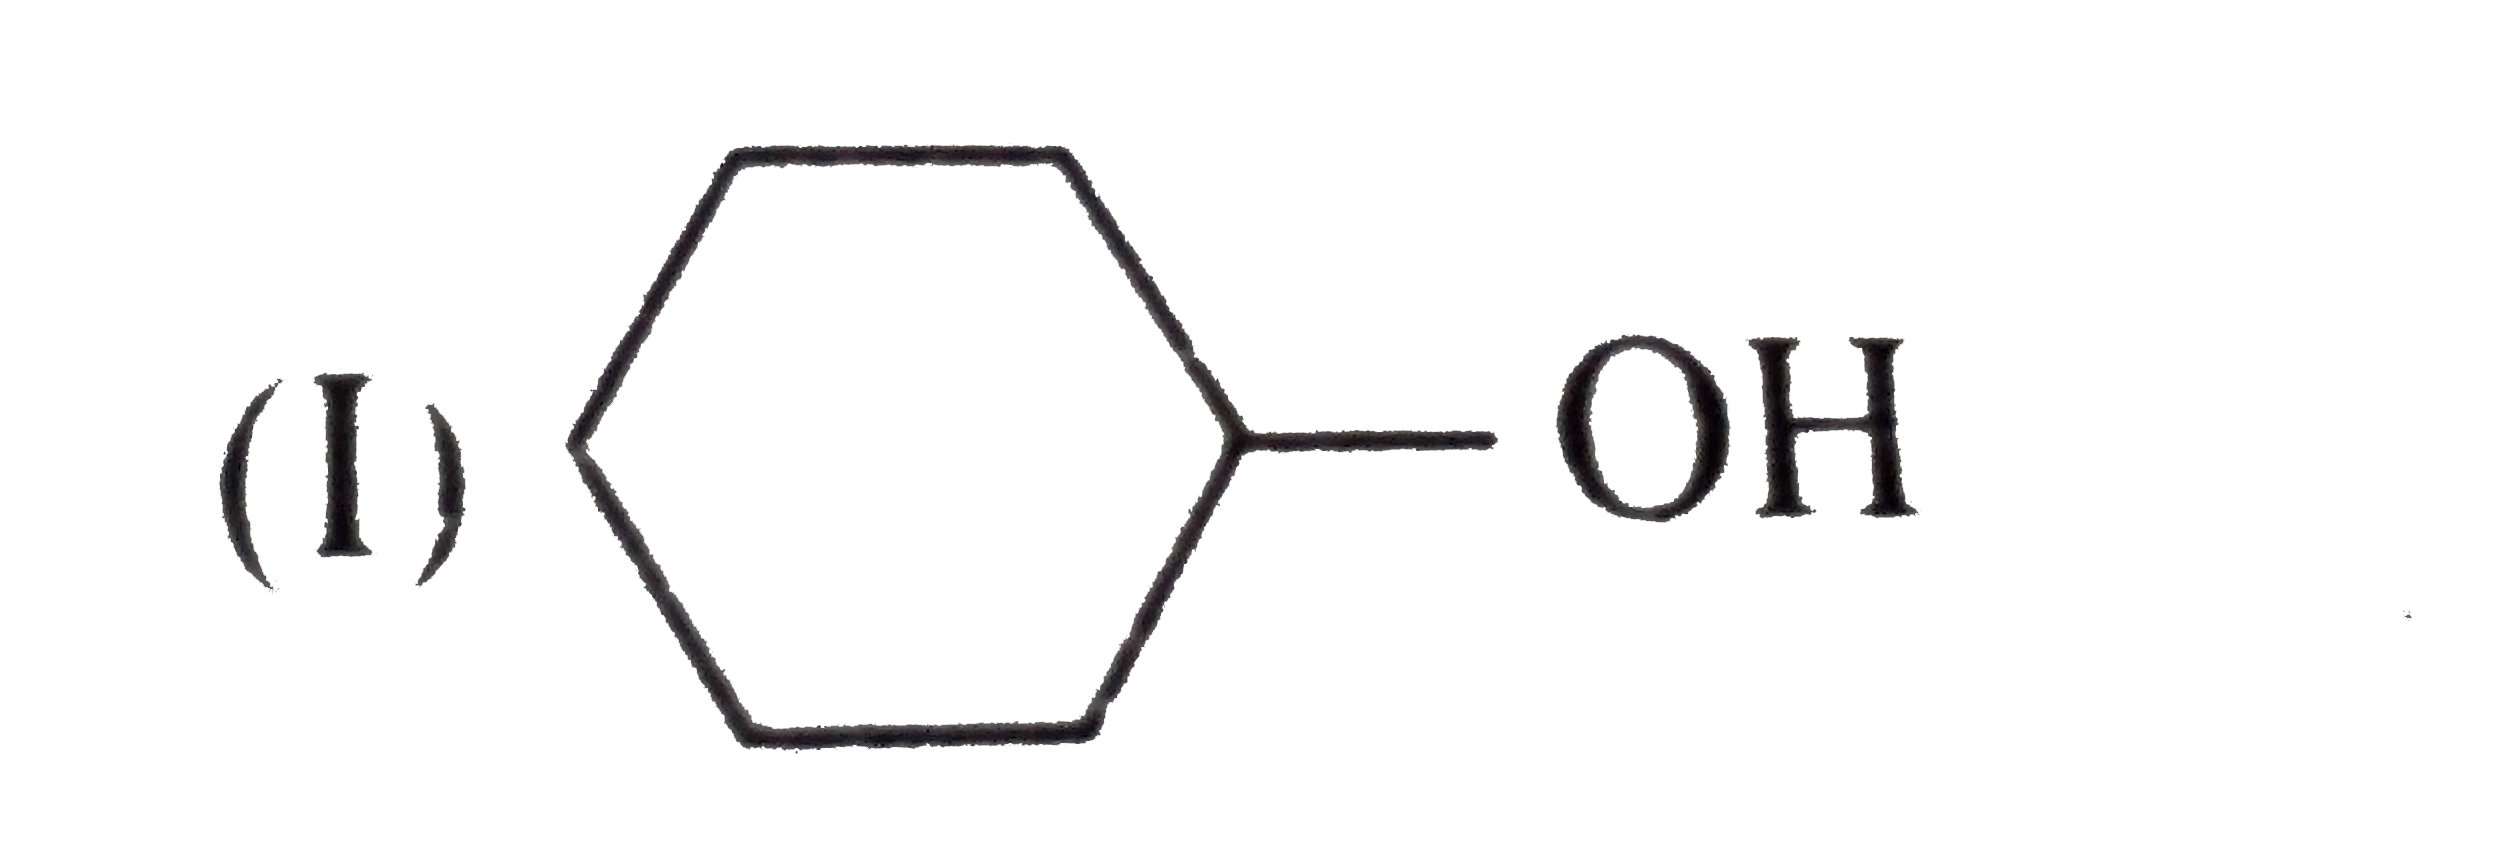 (II)
(II) 
(III) (IV)
(IV) 
View SolutionGive decreasing order of the following towards NA reaction.
I.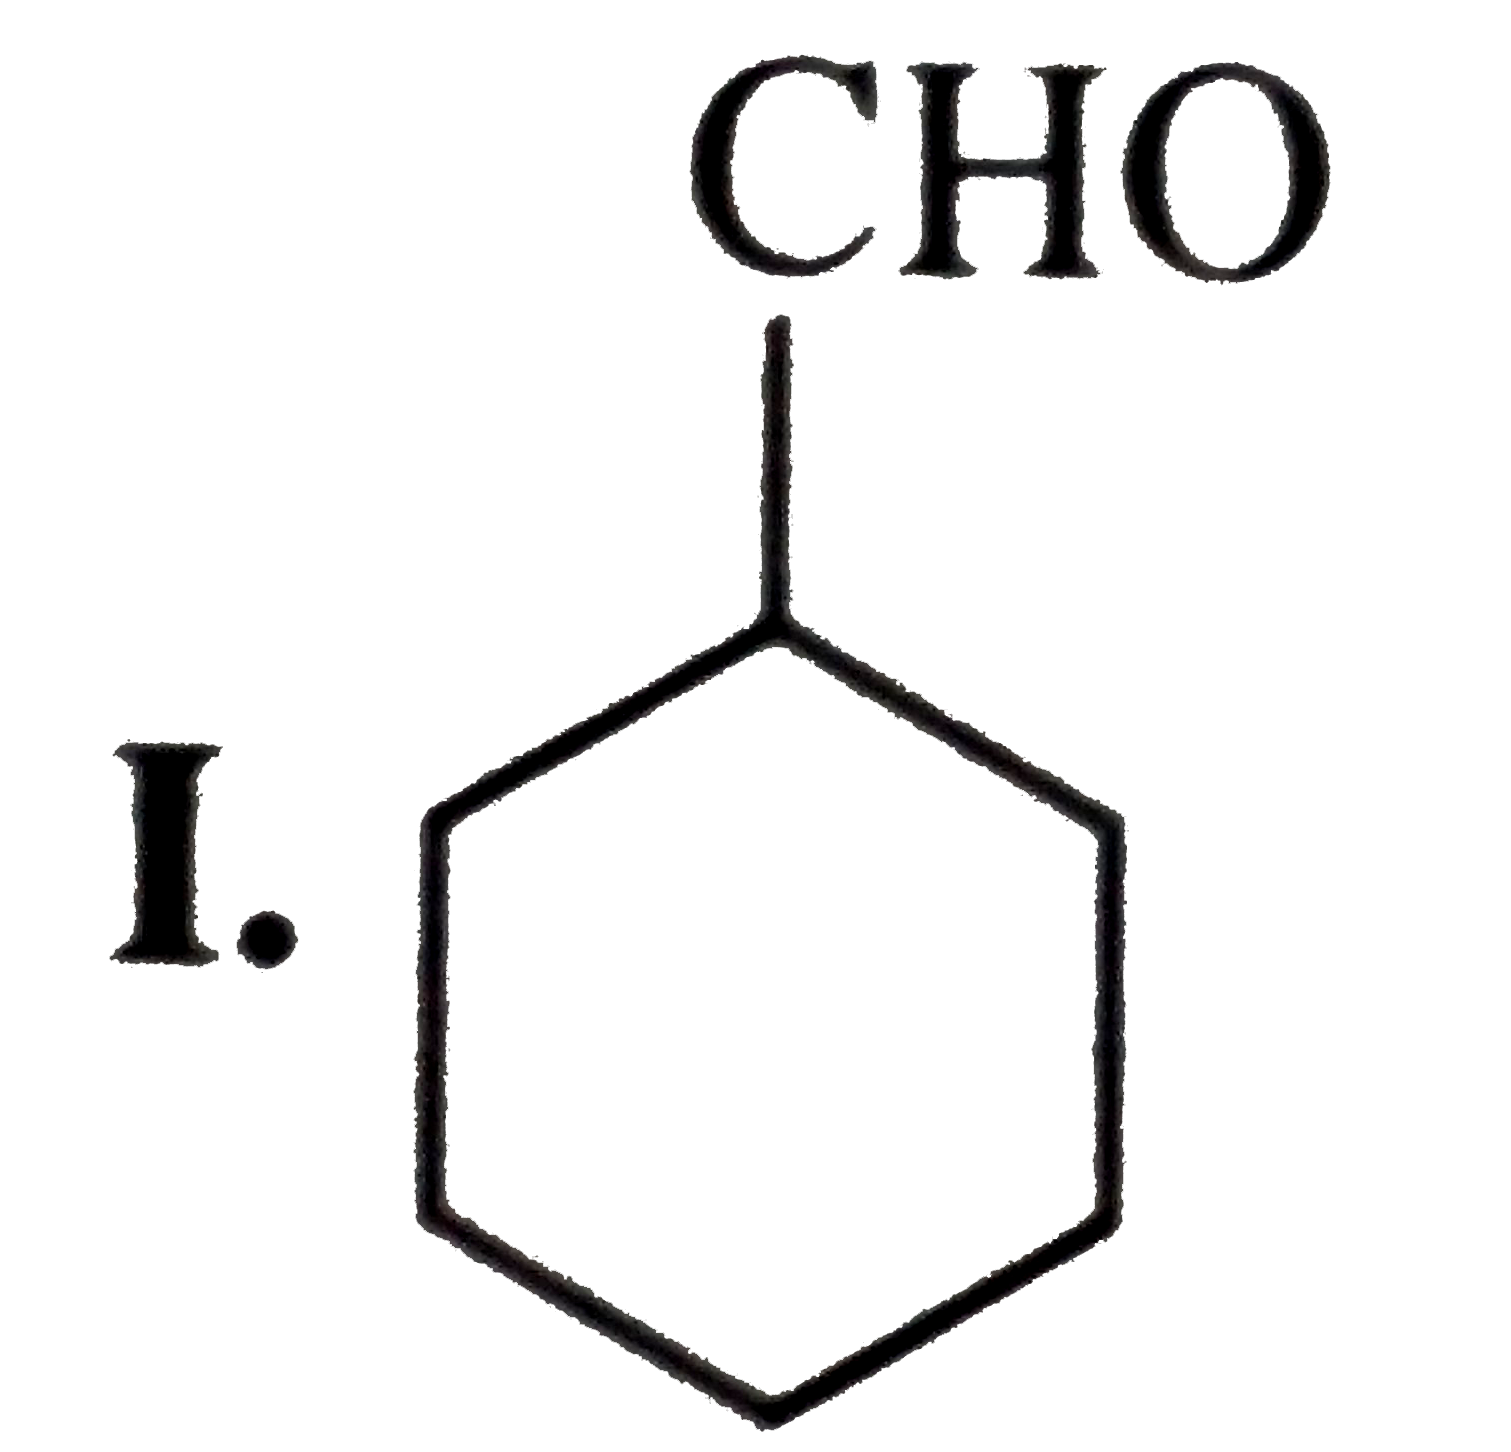 II.
II. 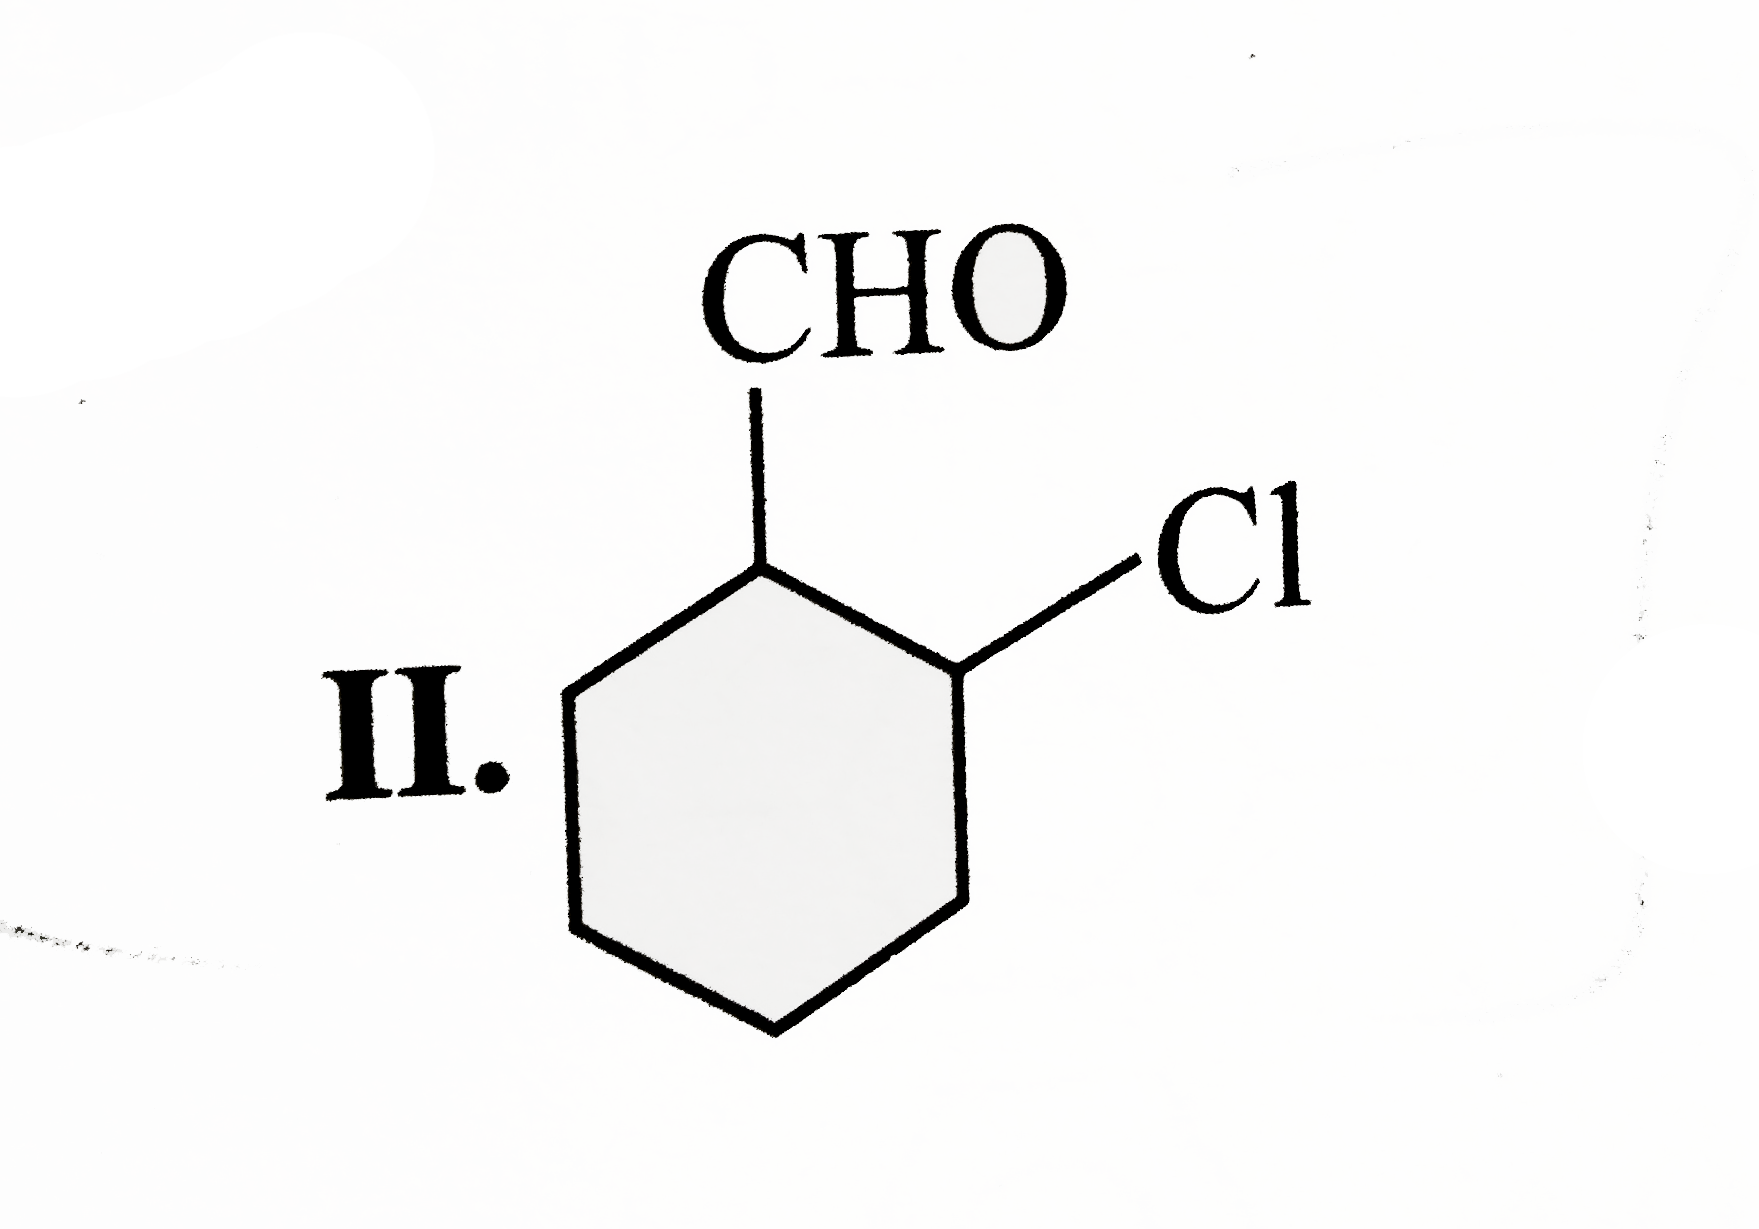
III.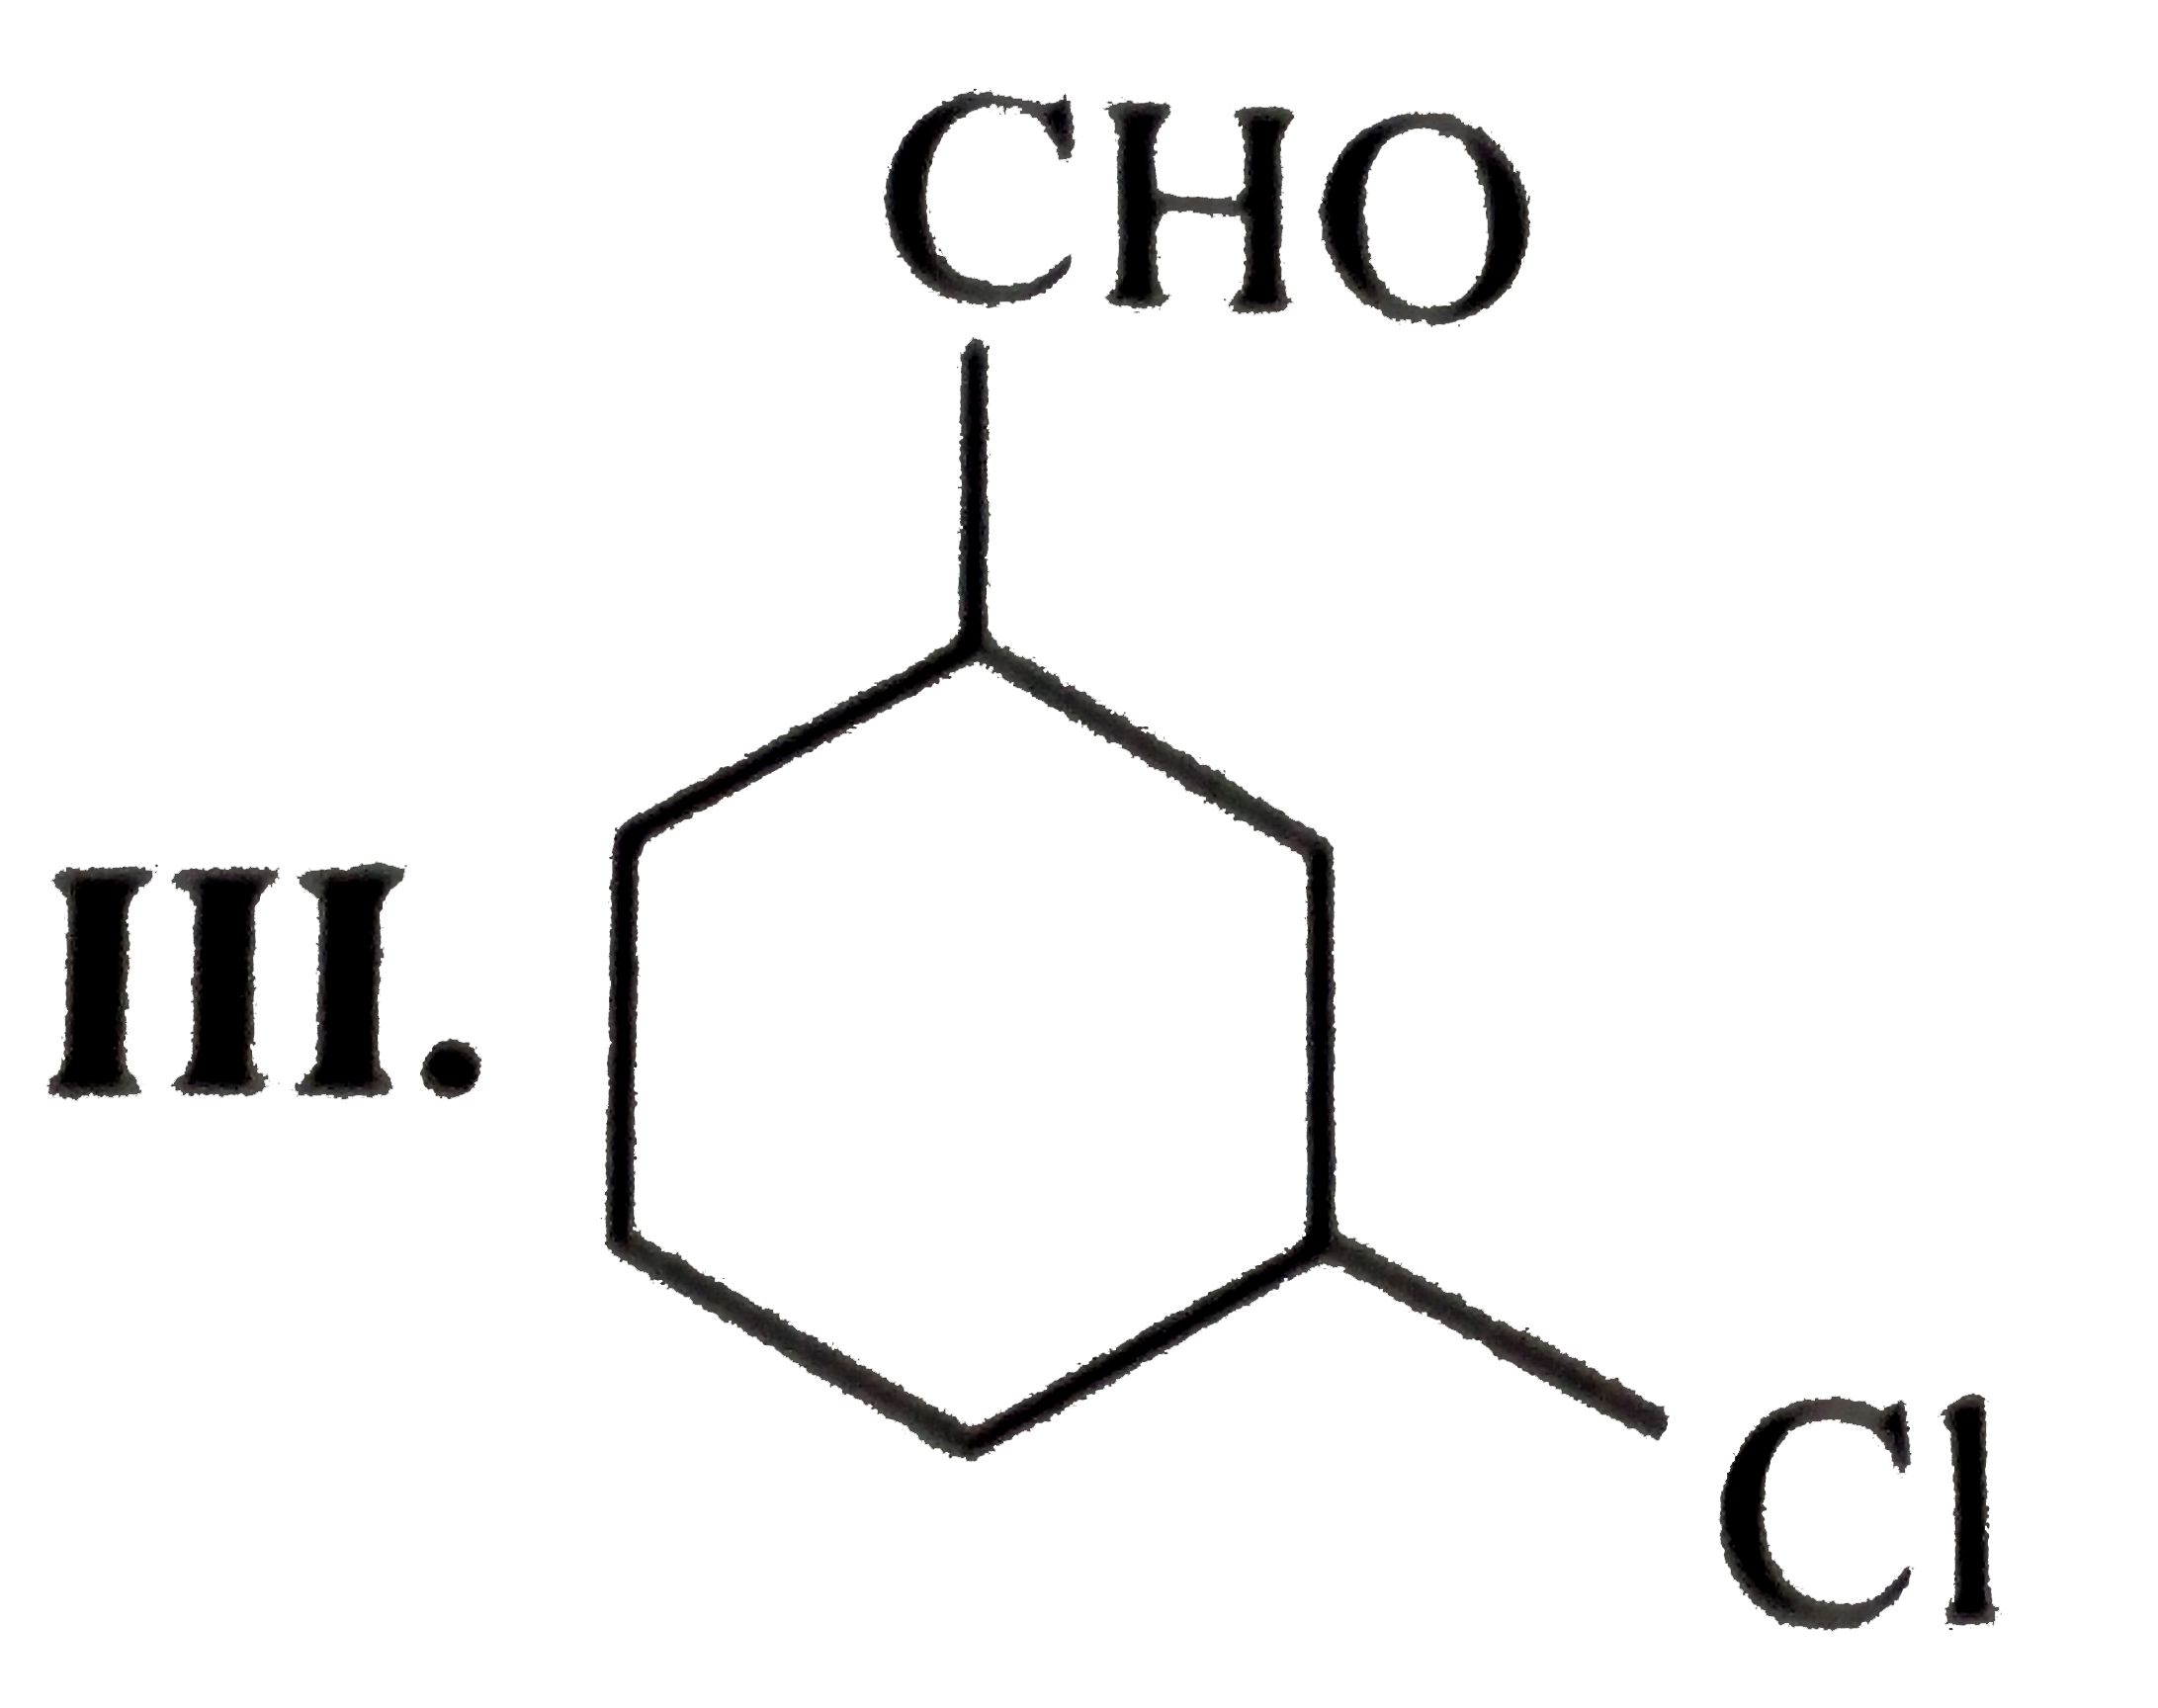 IV.
IV. 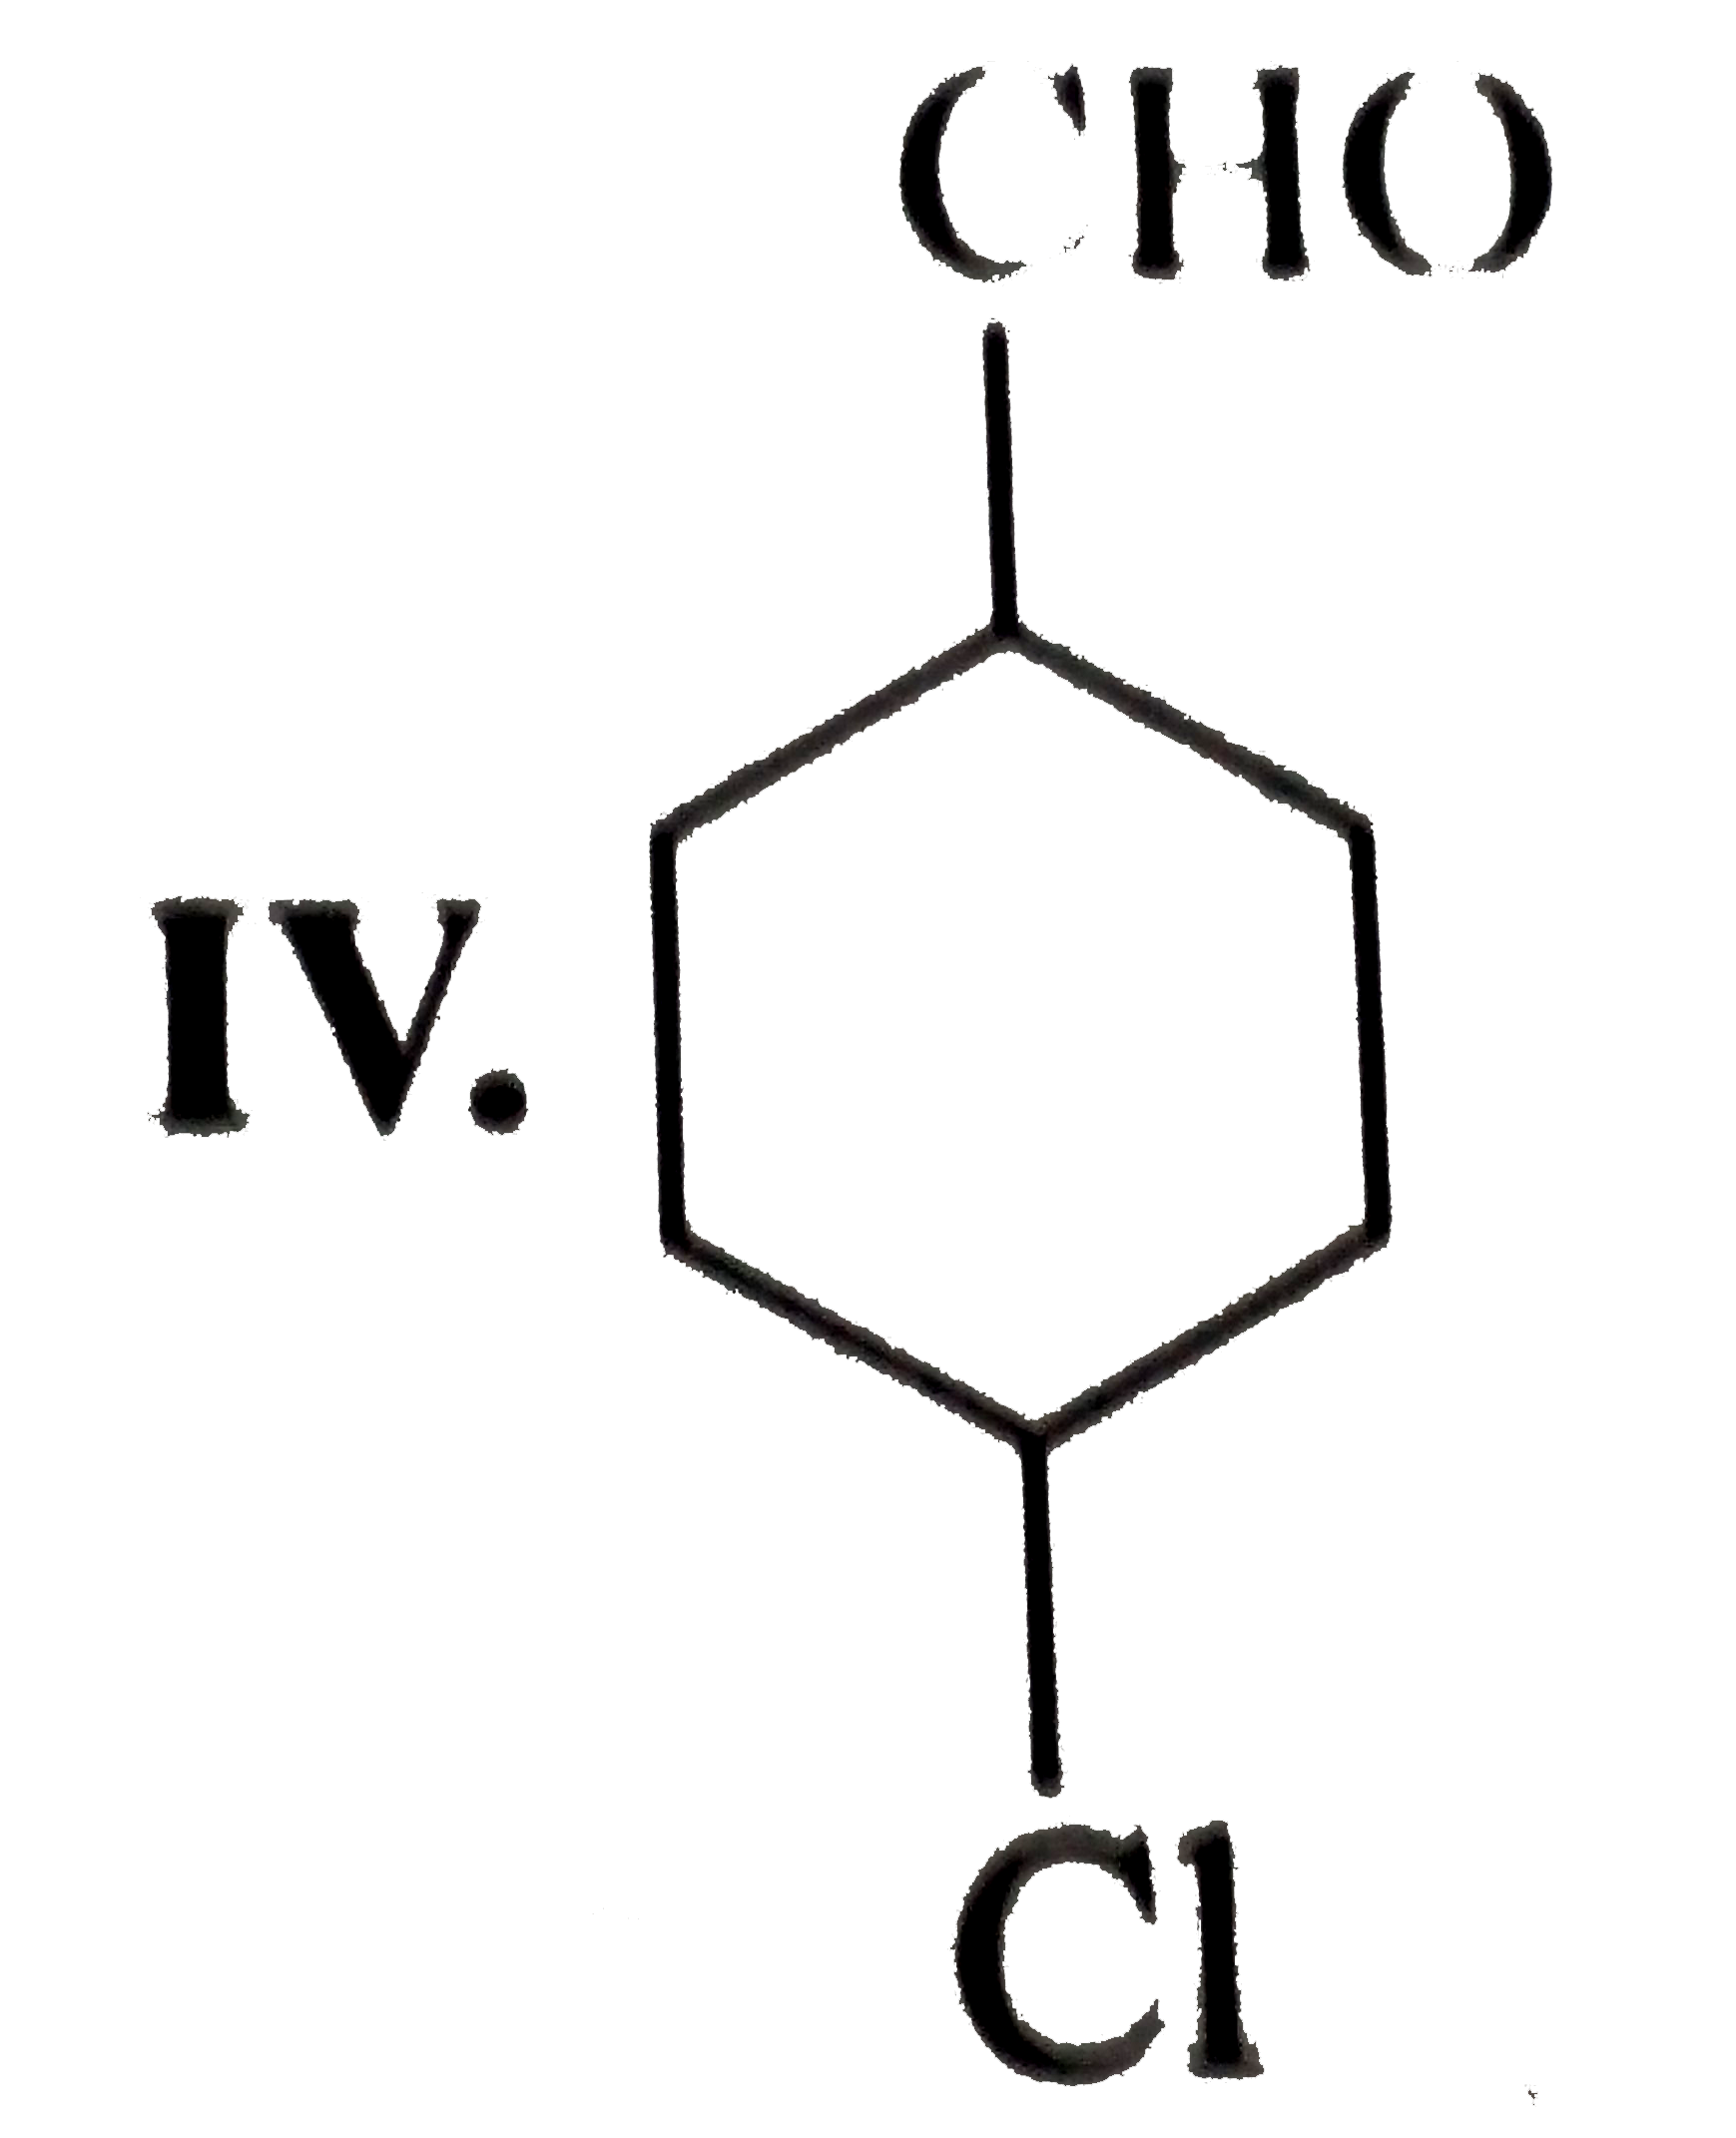
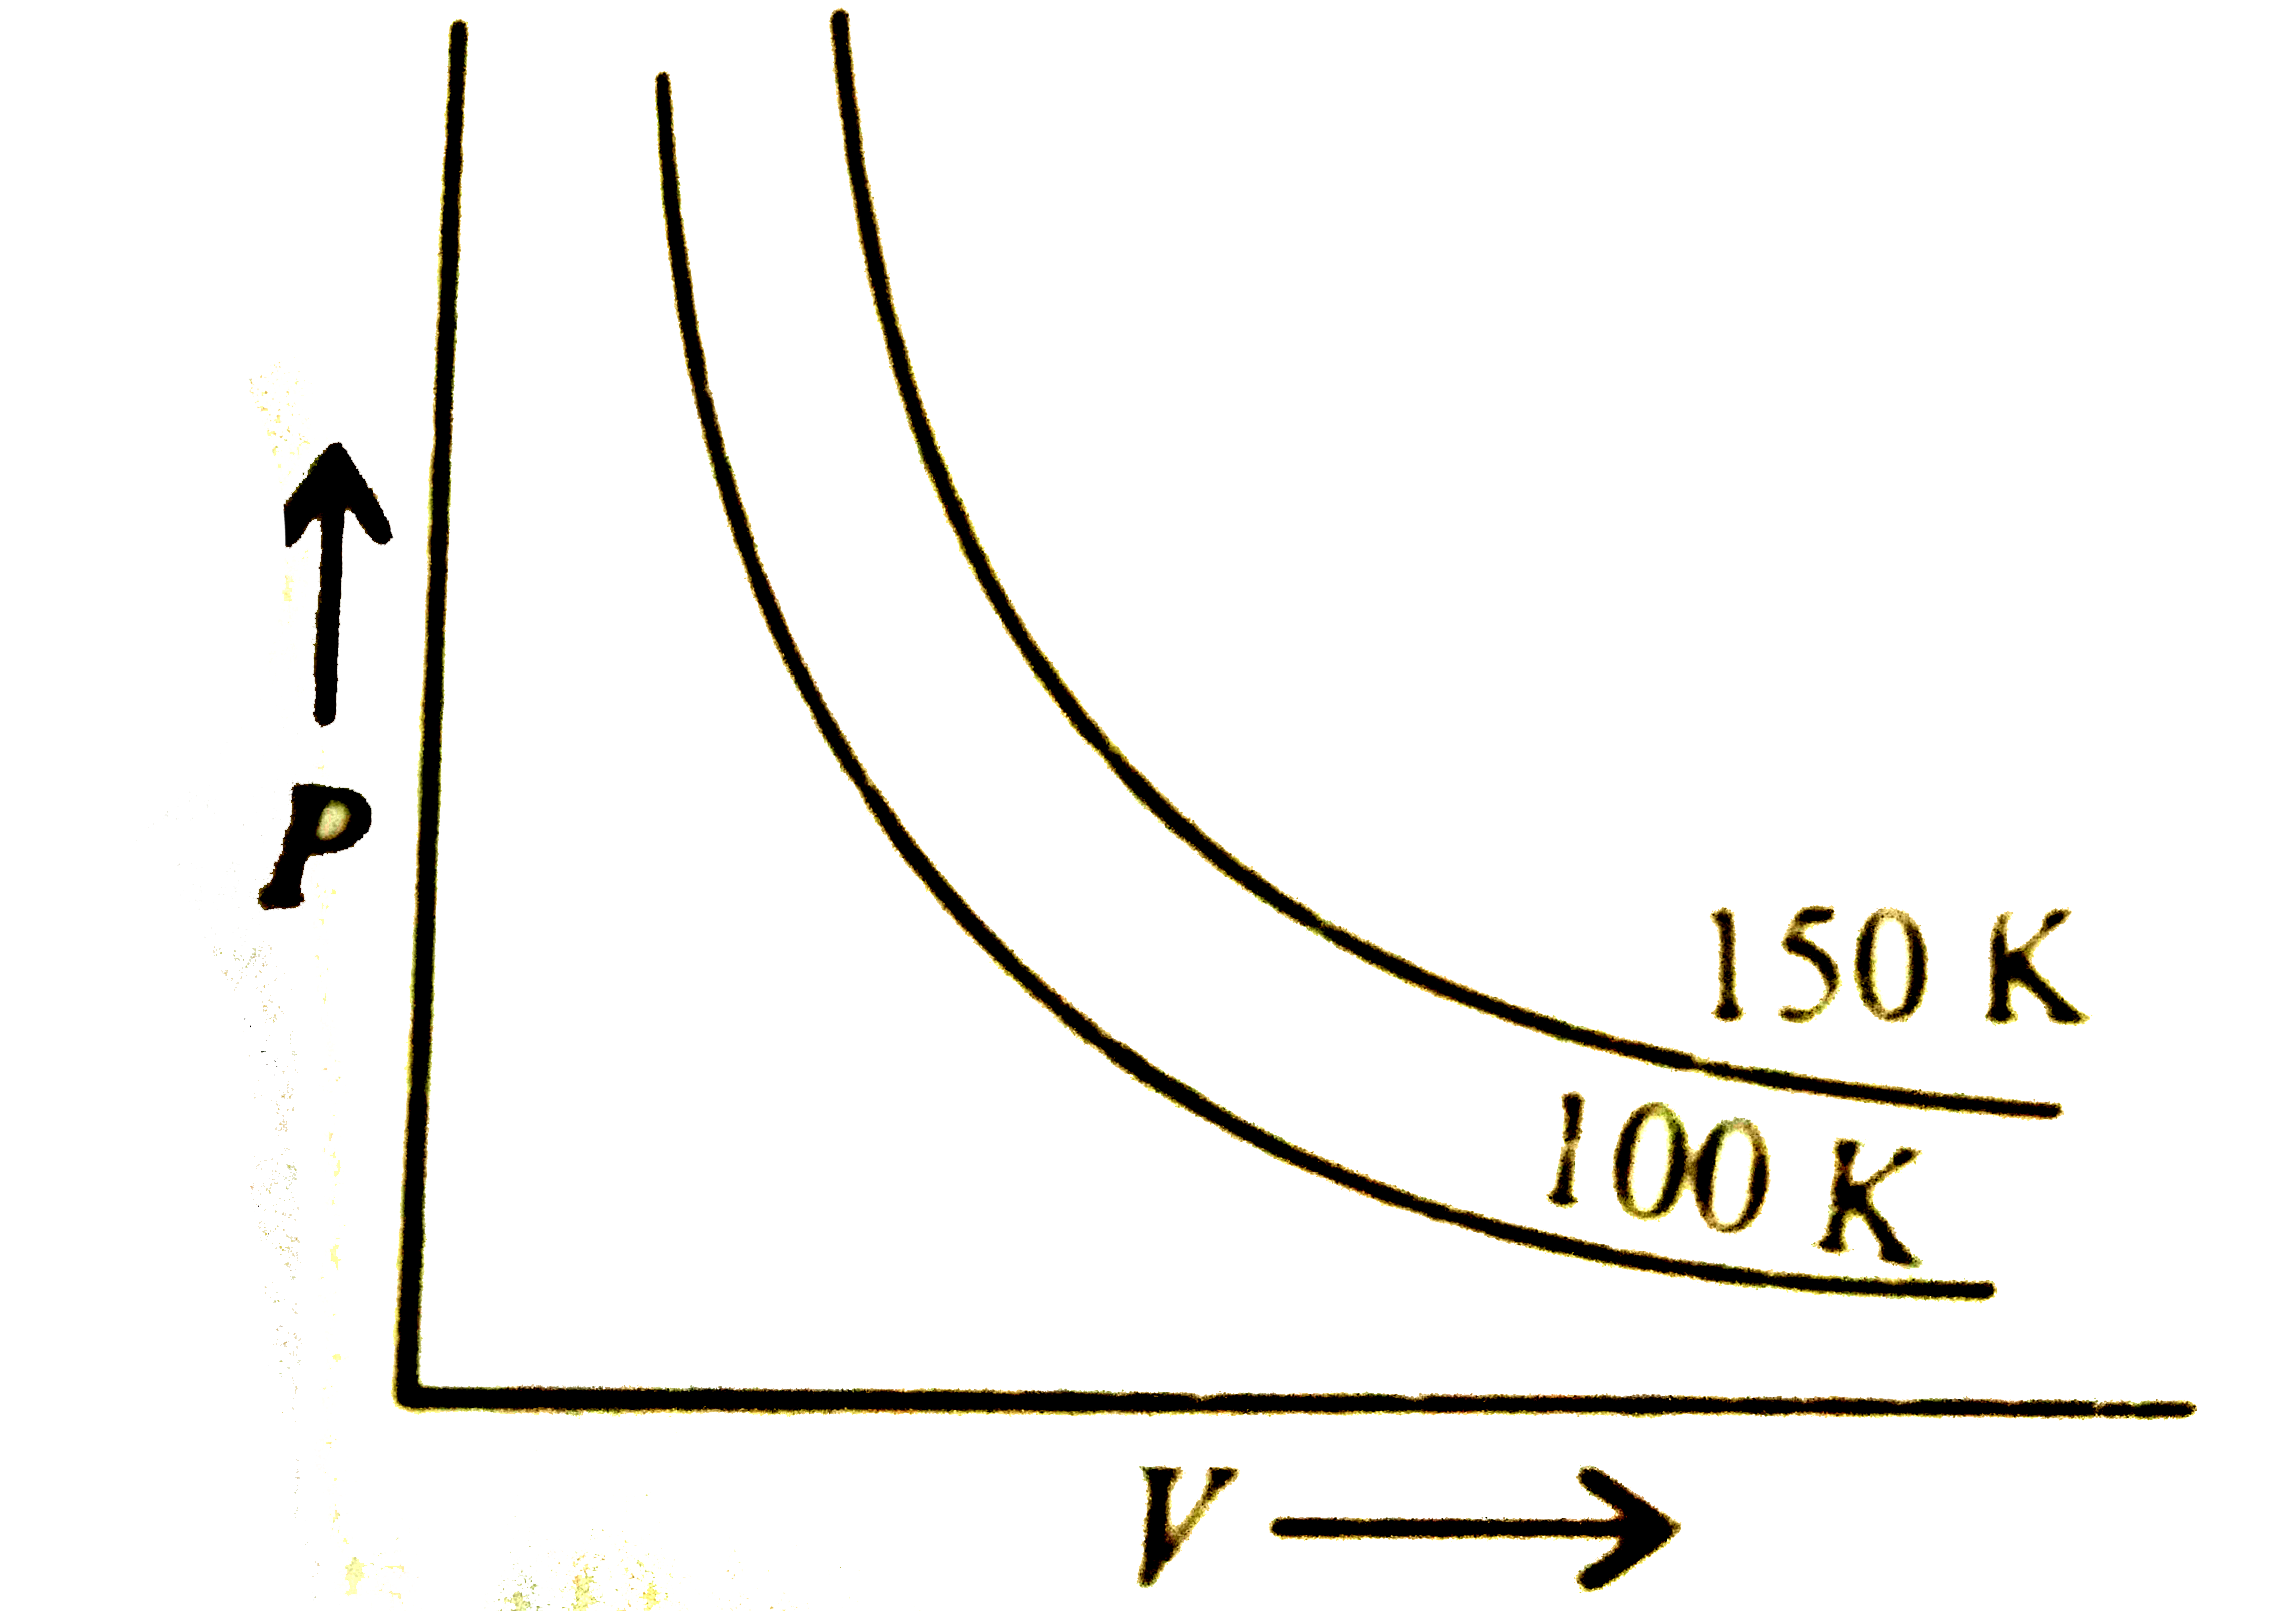
View SolutionA graph is plotted between pressure and volume at different temperatures . On the basis of the graph what changes will you observe in the volume if
(i) the pressure is increased at constant temperature .
(ii) the temperature is decreased at constant pressure .
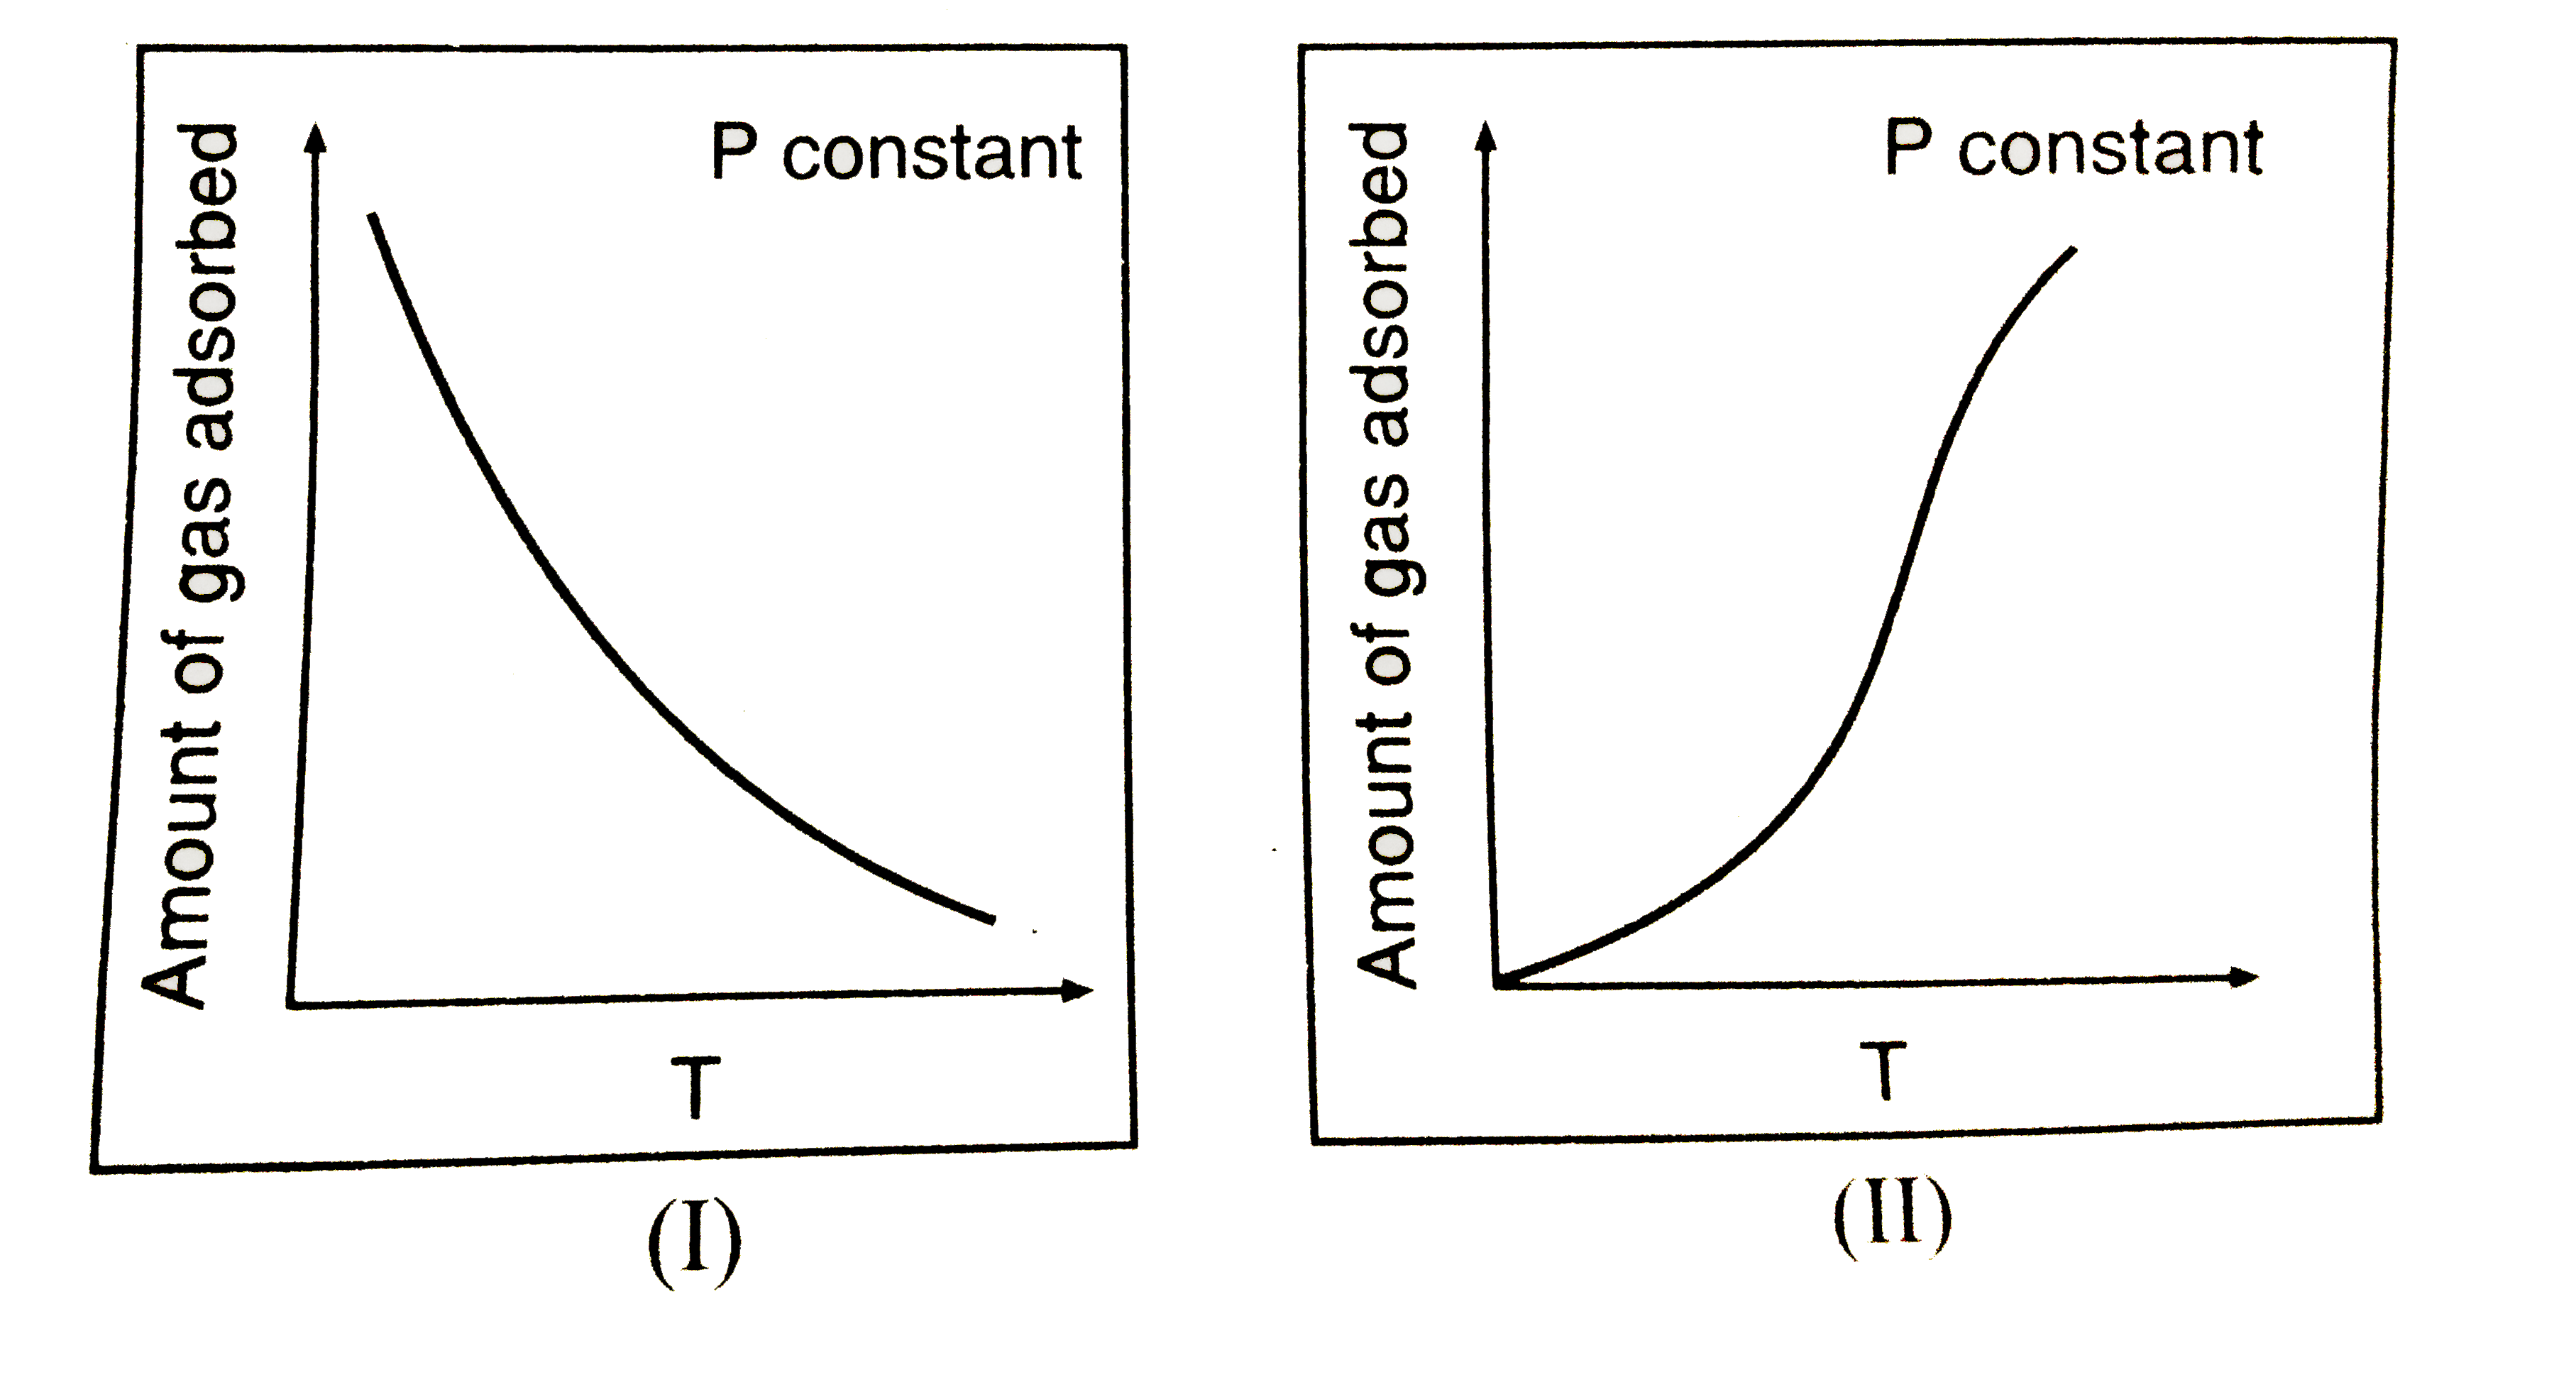
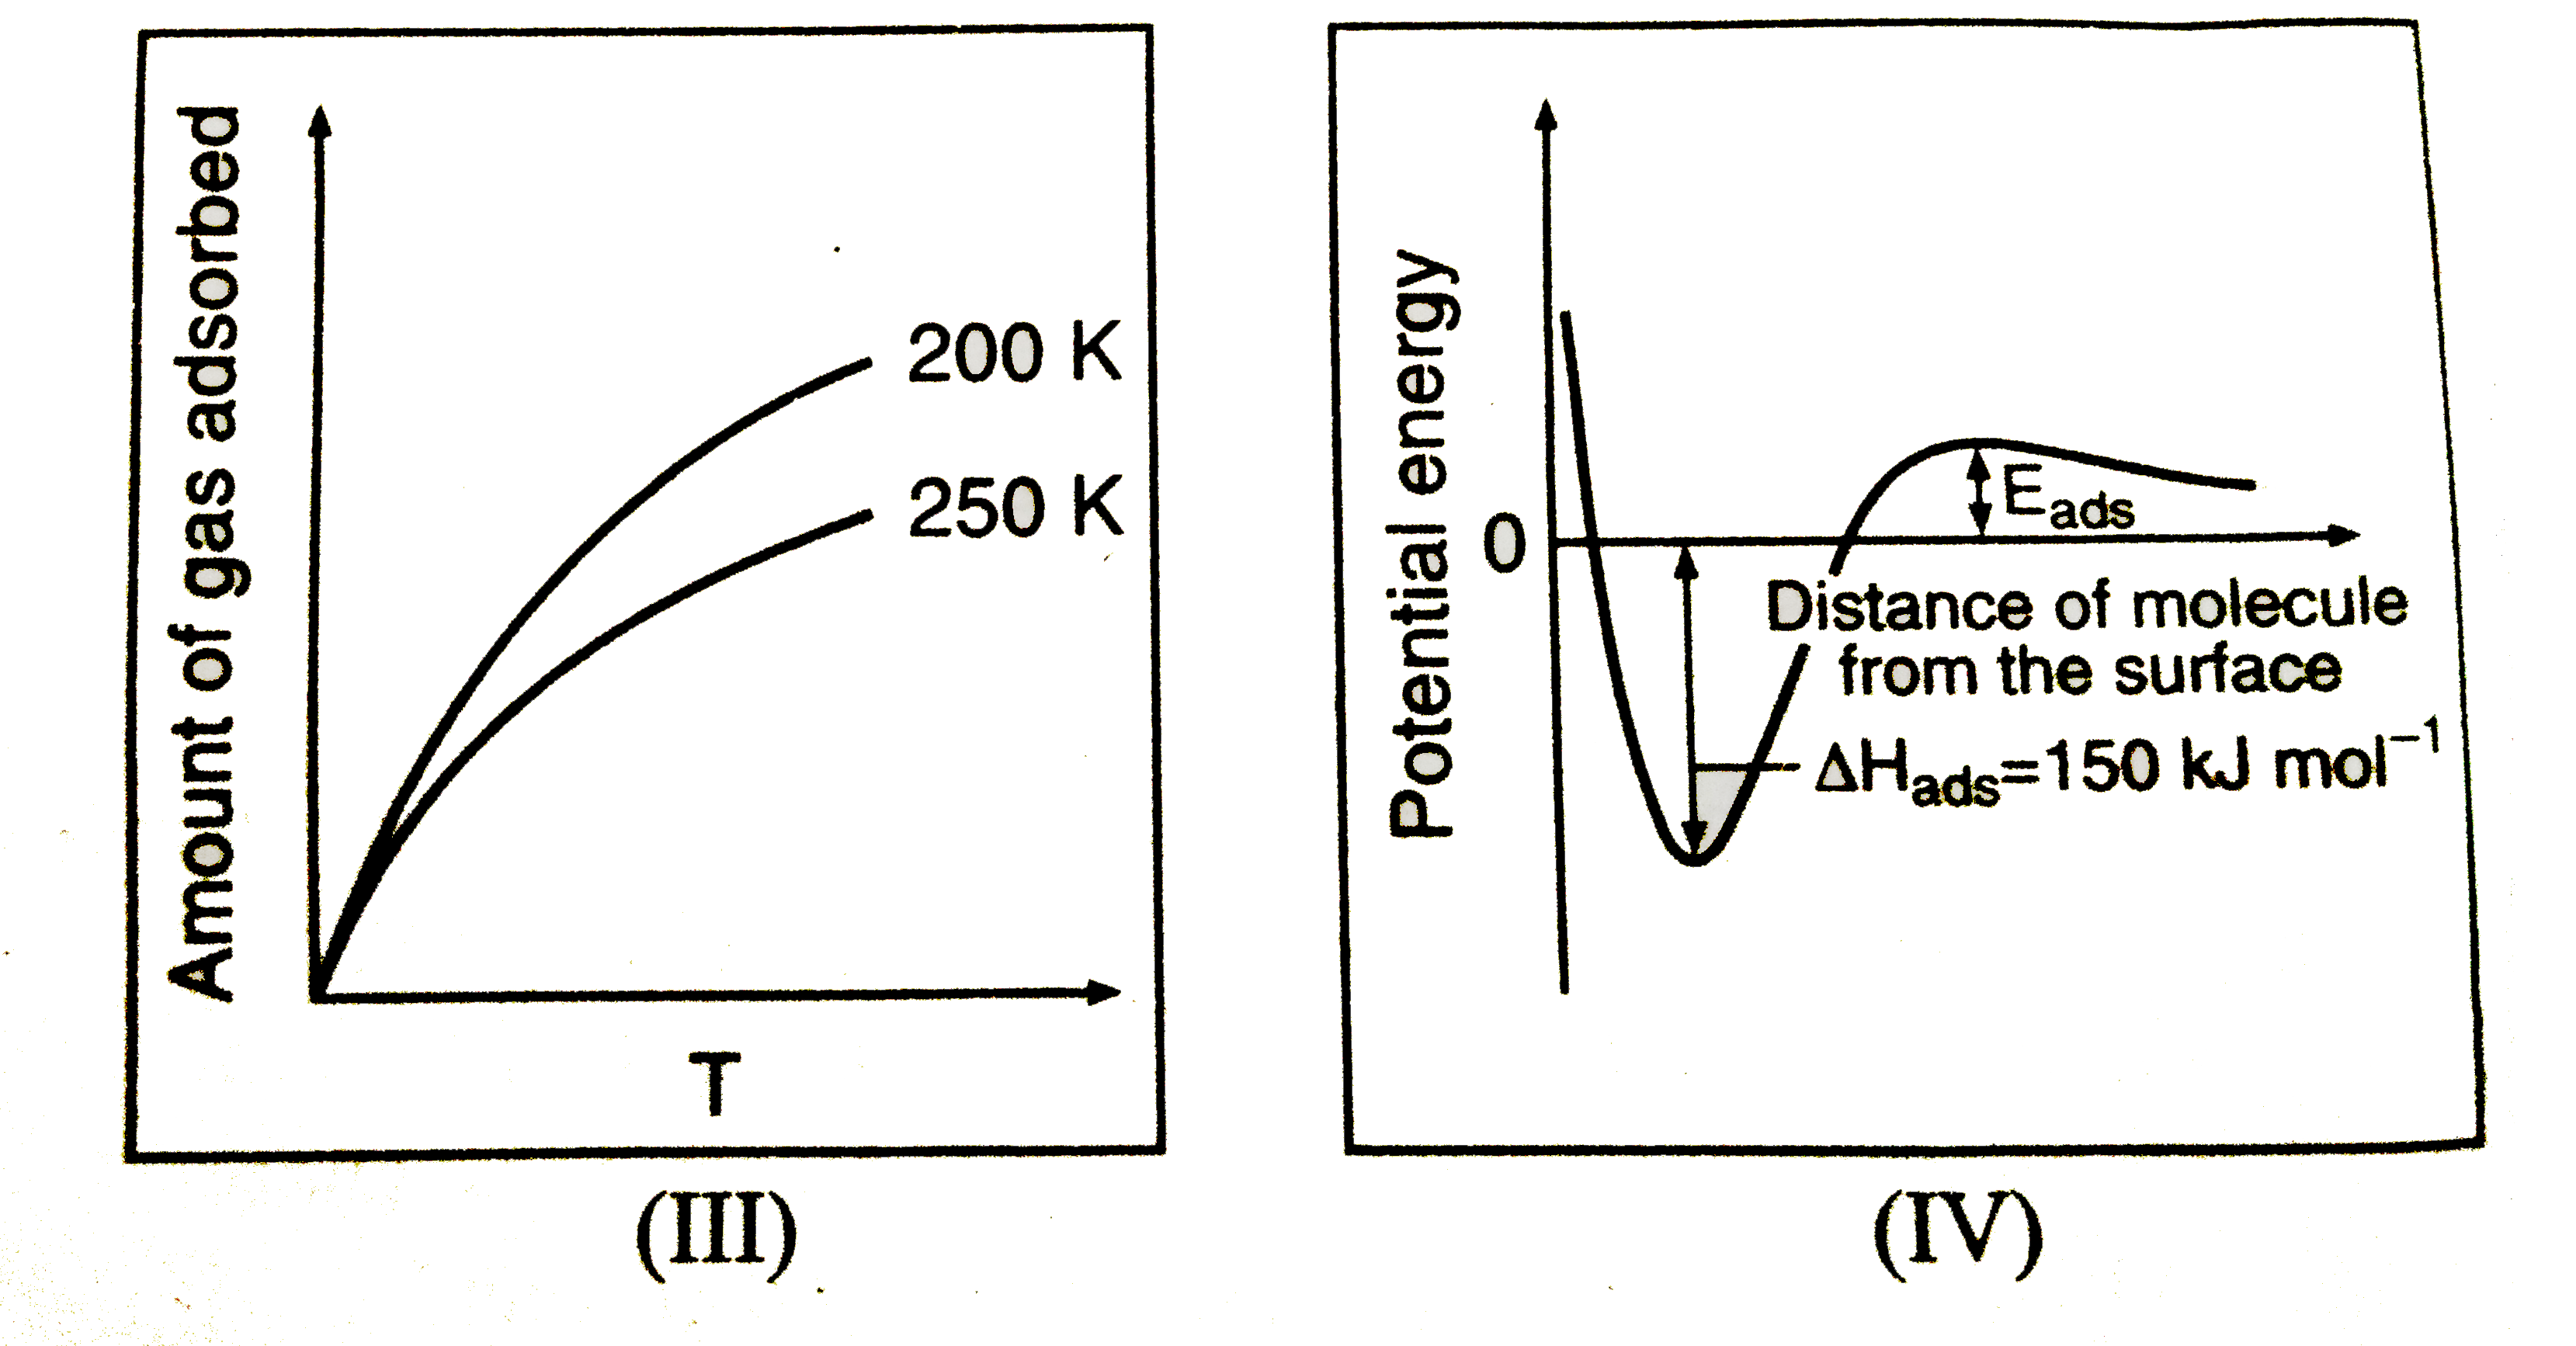
View SolutionThe given graph/data I, II, III and IV represent general trends observed for different physisorption and chemisorption processes under mild conditions of temperature and pressure. Which of the following choice(s) about I, II, III and IV is (are) correct?
The correct choice is :

View SolutionThe given graph/data I,II,III and IV represent general trends observed for different physisorption and chemisorption processes under mild conditions of temperature and pressure . Which of the following choice(s) about I,II,III, and IV is/are correct ?
View Solution
