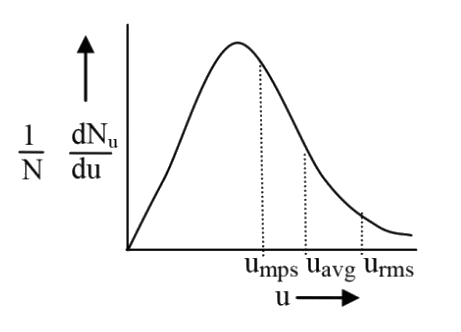
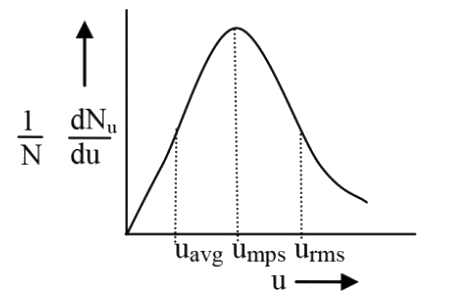
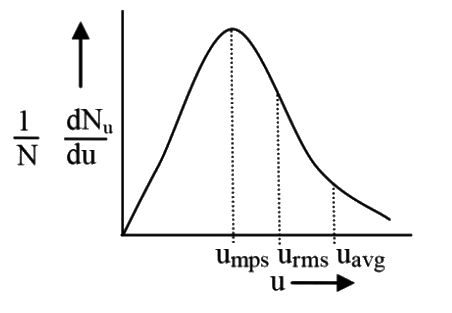
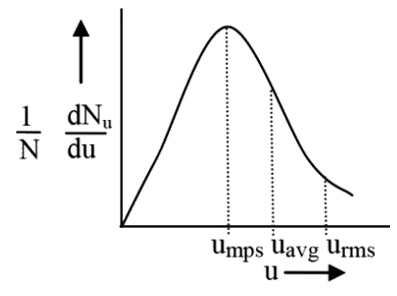
Which of the following plot is correct about Maxwell's speed distribution low ?


The correct Answer is:D
To solve the question regarding Maxwell's speed distribution law, we need to analyze the relationship between the most probable speed, average speed, and root mean square (RMS) speed of gas molecules. Here’s a step-by-step breakdown of the solution:
Step 1: Understand the Definitions
1. Most Probable Speed (v_mp): This is the speed at which the maximum number of molecules are found. It corresponds to the peak of the distribution curve.
2. Average Speed (v_avg): This is the mean speed of all the molecules in the gas.
3. Root Mean Square Speed (v_rms): This is the square root of the average of the squares of the speeds of the molecules.
Step 2: Recall the Formulas
The formulas for these speeds in terms of temperature (T) and molecular mass (M) are:
- vrms=√3RTM
- vavg=√8RTπM
- vmp=√2RTM
Step 3: Compare the Speeds
To compare these speeds, we can derive the ratios:
- vrms:vavg:vmp=√3:√8π:√2
Calculating the approximate values:
- √3≈1.732
- √8π≈1.595
- √2≈1.414
From this, we can see that:
- vrms>vavg>vmp
Step 4: Analyze the Graphs
In the context of the graphs provided:
- The x-axis represents speed, and the y-axis represents the fractional number of molecules.
- The peak of the graph should correspond to the most probable speed, which is the highest point on the curve.
- The average speed should be to the right of the most probable speed, and the RMS speed should be to the right of the average speed.
Step 5: Identify the Correct Plot
Based on the analysis:
- The correct plot will have the peak at the most probable speed, followed by the average speed, and then the RMS speed.
Conclusion
Thus, the correct option among the provided graphs is the one where:
- Most Probable Speed (peak) < Average Speed < RMS Speed.
1. Most Probable Speed (v_mp): This is the speed at which the maximum number of molecules are found. It corresponds to the peak of the distribution curve.
2. Average Speed (v_avg): This is the mean speed of all the molecules in the gas.
3. Root Mean Square Speed (v_rms): This is the square root of the average of the squares of the speeds of the molecules.
The formulas for these speeds in terms of temperature (T) and molecular mass (M) are:
- vrms=√3RTM
- vavg=√8RTπM
- vmp=√2RTM
To compare these speeds, we can derive the ratios:
- vrms:vavg:vmp=√3:√8π:√2
- √3≈1.732
- √8π≈1.595
- √2≈1.414
- vrms>vavg>vmp
In the context of the graphs provided:
- The x-axis represents speed, and the y-axis represents the fractional number of molecules.
- The peak of the graph should correspond to the most probable speed, which is the highest point on the curve.
- The average speed should be to the right of the most probable speed, and the RMS speed should be to the right of the average speed.
Based on the analysis:
- The correct plot will have the peak at the most probable speed, followed by the average speed, and then the RMS speed.
Thus, the correct option among the provided graphs is the one where:
- Most Probable Speed (peak) < Average Speed < RMS Speed.
Similar Questions
Knowledge Check
- Question 1 - Select One
Which of the following is not correct about DNA?
AIt occurs in the cytoplasm of the cell.BThe sugar present is 2-deoxy D(-) ribose.CIt has a double strand a-helix.DIt has property of replication.
Which of the following plots is/are correct?
View SolutionWhich of the following is correct about growth?
View SolutionWhich of the following is correct about symplast?
View SolutionWhich of the following is correct about legumes?
View Solutionwhich of the following is correct about viroids?
View SolutionWhich of the followings is not correct about colloids?
View SolutionWhich of the following is correct about dinoflagellates?
View Solution

