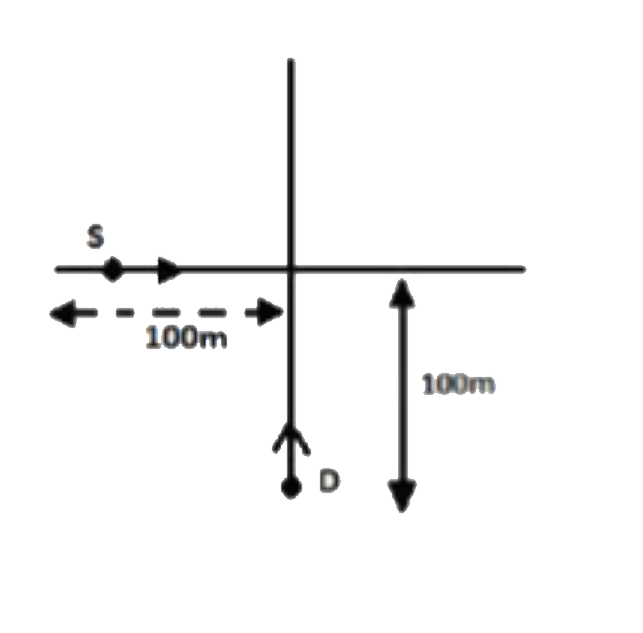
The figure shows the location of a source and detector at time t = 0. The source and detector are moving with velocities respectively . The frequency of signals received by the detector at the moment when the source cros the origin is (the frequency of the source is 100 Hz . Velocity bof sound .)

97 Hz
47 Hz
90 Hz
60 Hz
The correct Answer is:A
Step by step video & image solution for The figure shows the location of a source and detector at time t = 0. The source and detector are moving with velocities v_s = 5hati m s^(-1) and v_D = 10 hatj ms^(-1) respectively . The frequency of signals received by the detector at the moment when the source cros the origin is (the frequency of the source is 100 Hz . Velocity bof sound 330 m s^(-1) .) by Physics experts to help you in doubts & scoring excellent marks in Class 12 exams.
Updated on:21/07/2023Similar Questions
A source and a detector move away from each other, each with a speed of 10ms−1 with respect to the ground with no wind. If the detector detects a frequency 1950 Hz of the sound coming from the source, what is the original frequency of the source? Speed of sound in air =340ms−1.
View SolutionA source and a detector move away from each other, each with a speed of 10 m/s with respect to ground with no wind. If the detector detects a frequency 1650 Hz of the sound coming from the source, what is the original frequency of the source? (speed of sound = 340 m/s
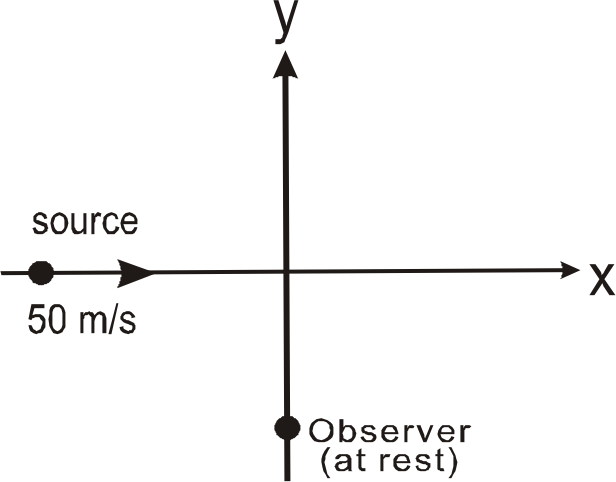
View SolutionA sound source moving with speed 50 m/s along x-axis and observer at rest on y-axis.If the frequency observed by observer when source crosses the origin is 96 Hz, then the original frequency of source is :(speed of sound is given medium is 200 m/s)

View SolutionSource and observer start moving simulatneously along x and y-axis respectively. The speed of source is twice the speed of observer V0. If the ratio of observer frequency to the frequency of the source is 0.75, find the velocity of sound.
View SolutionSource and observer start moving simulatneously along x and y-axis respectively. The speed of source is twice the speed of observer V0. If the ratio of observer frequency to the frequency of the source is 0.75, find the velocity of sound.
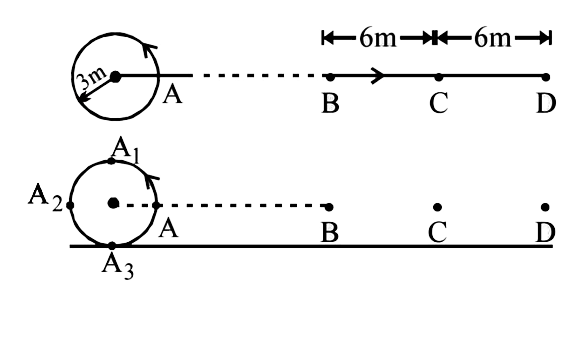
View SolutionA source of sound is moving along a circular orbit of radius 3meter with an angular velocity of 10rad/s. A sound detector located far away from the source is executing linear simple harmonic motion along the line BD with an amplitude BC=CD=6meters. The frequency of oscillation of the detector is 5π per second. The source is at the point A when the detector is at the point B. If the source emits a continuous sound wave of frequency 340Hz, Find the maximum and the minimum frequencies recorded by the detector.

View SolutionA stationary source emits the sound of frequency f0=492 Hz. The sound is reflected by a large car approaching the source with a speed of 2ms−1. The reflected signal is received by the source and superposed with the original. What will be the beat frequency of the resulting signal in Hz? (Given that the speed of sound in air is 330ms−1 and the car reflects the sound at the frequency it has received).
View SolutionAn observer travelling with a constant velocity of 16.5ms−1, passes closes to a stationary source of sound and notices that there is a change of frequency of 50 Hz as he passes the source. Calculate the frequency of the source. (Speed of sound in air = 330 ms−1).
View SolutionA source of sound is moving along a circular orbit of radius 3 m with an angular velocity of 10 rad/s. A sound detector located far away from the source is executing linear S.H.M. along the line BD (see Fig. 14.4.13) with an amplitude BC = CD=6m. The frequency of oscillation of the detector is 5/π per second. The source is at the point BA when the detector is at the point B. If the source epiits a continuous sound wave of frequency 340 Hz, find the maximum and the minimum frequencies recorded by the detector.

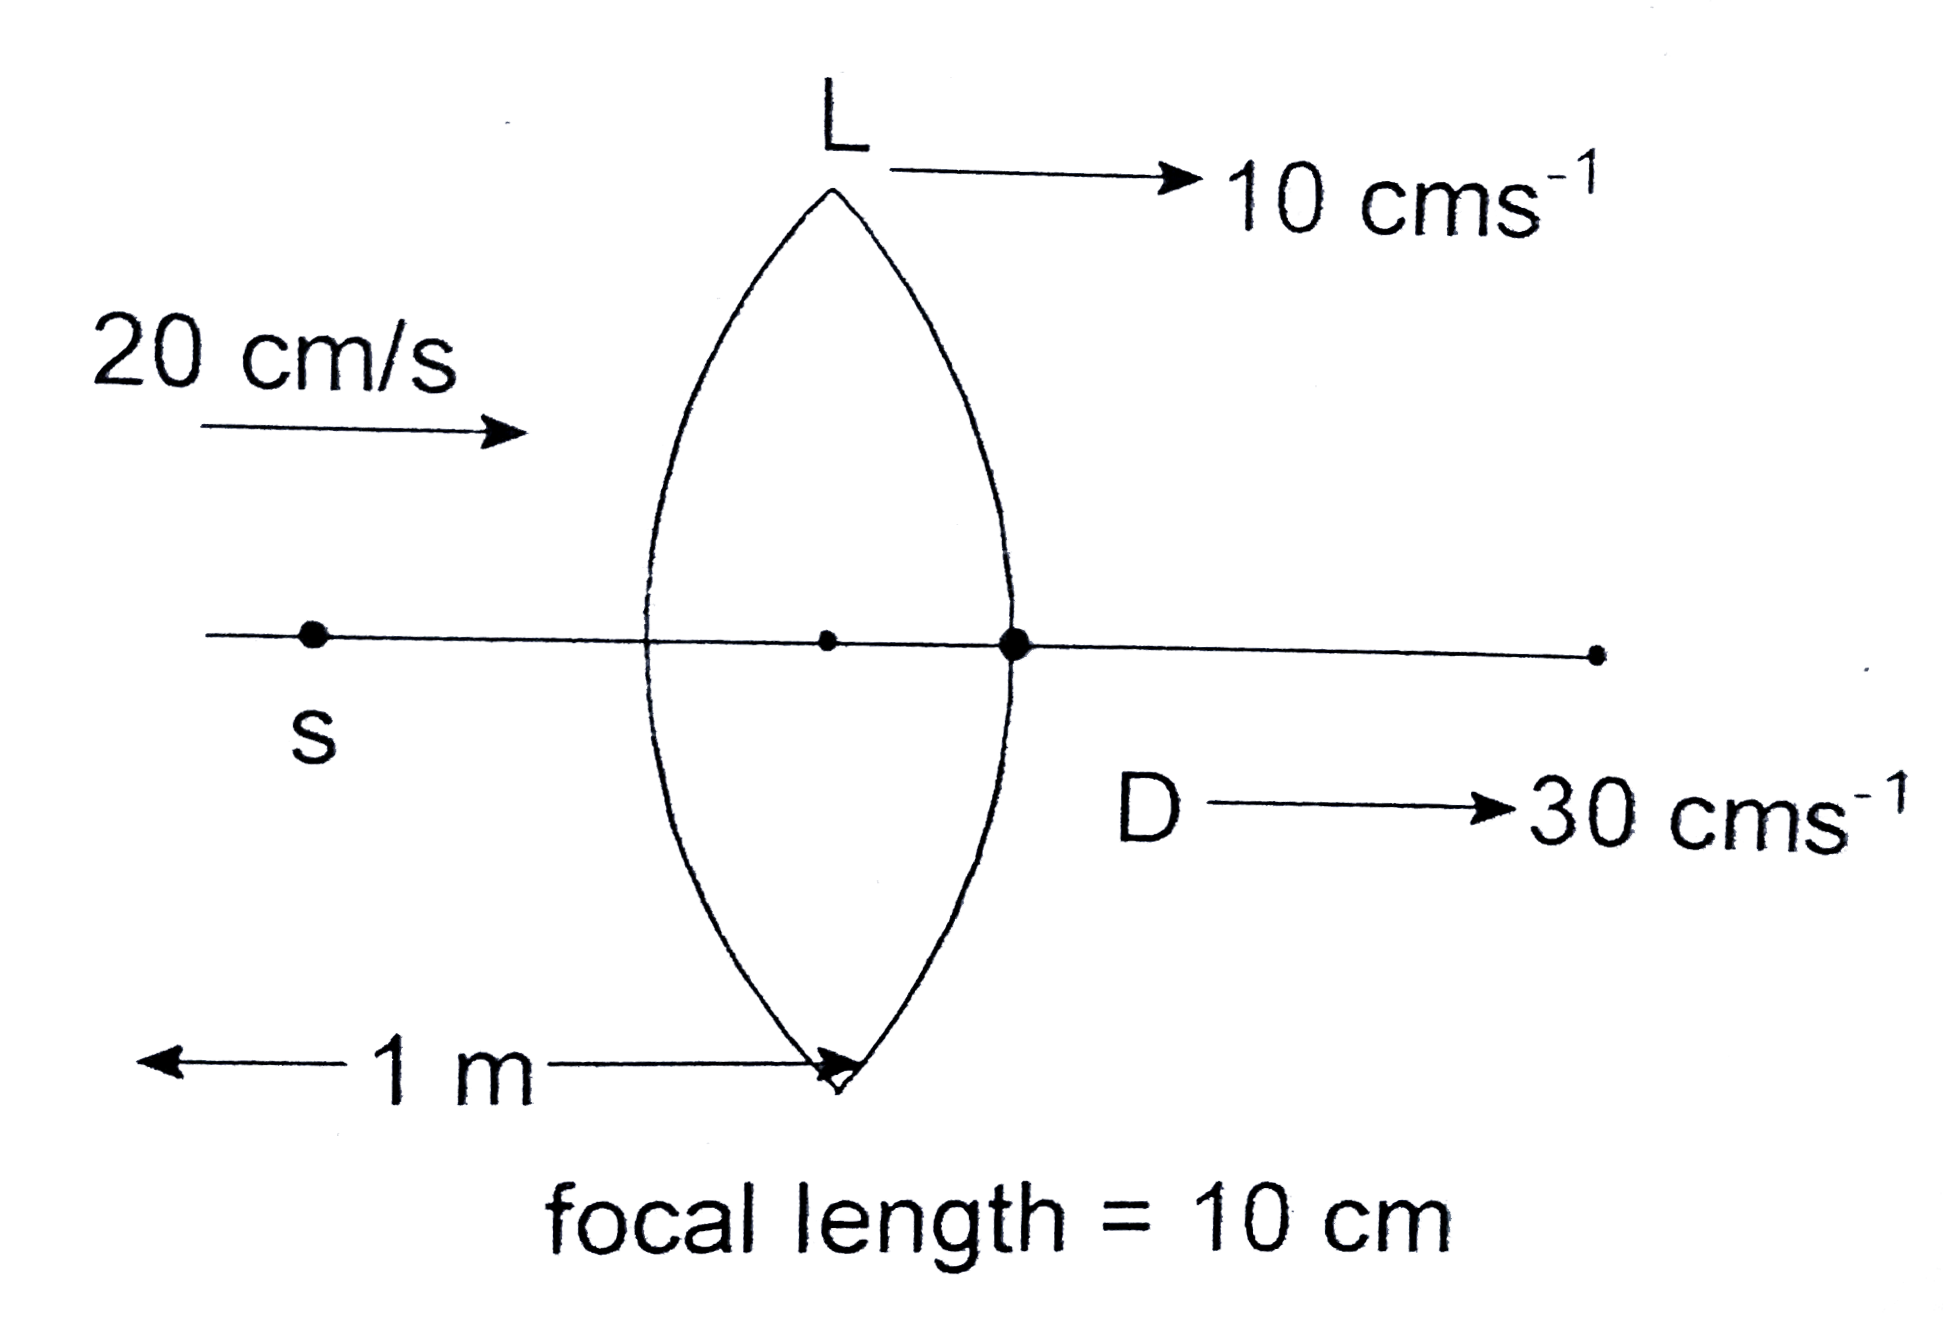
View SolutionThe figure shows the initial position of a point source of light s, a detector D and lens L. Now at t=0 all three starts moving toward right with different velocity as shown in figure. The times at which detector receives the maximum light.

View Solution
