For V versus T curves at constant pressure P1andP2 for and ideal gas shown in figure-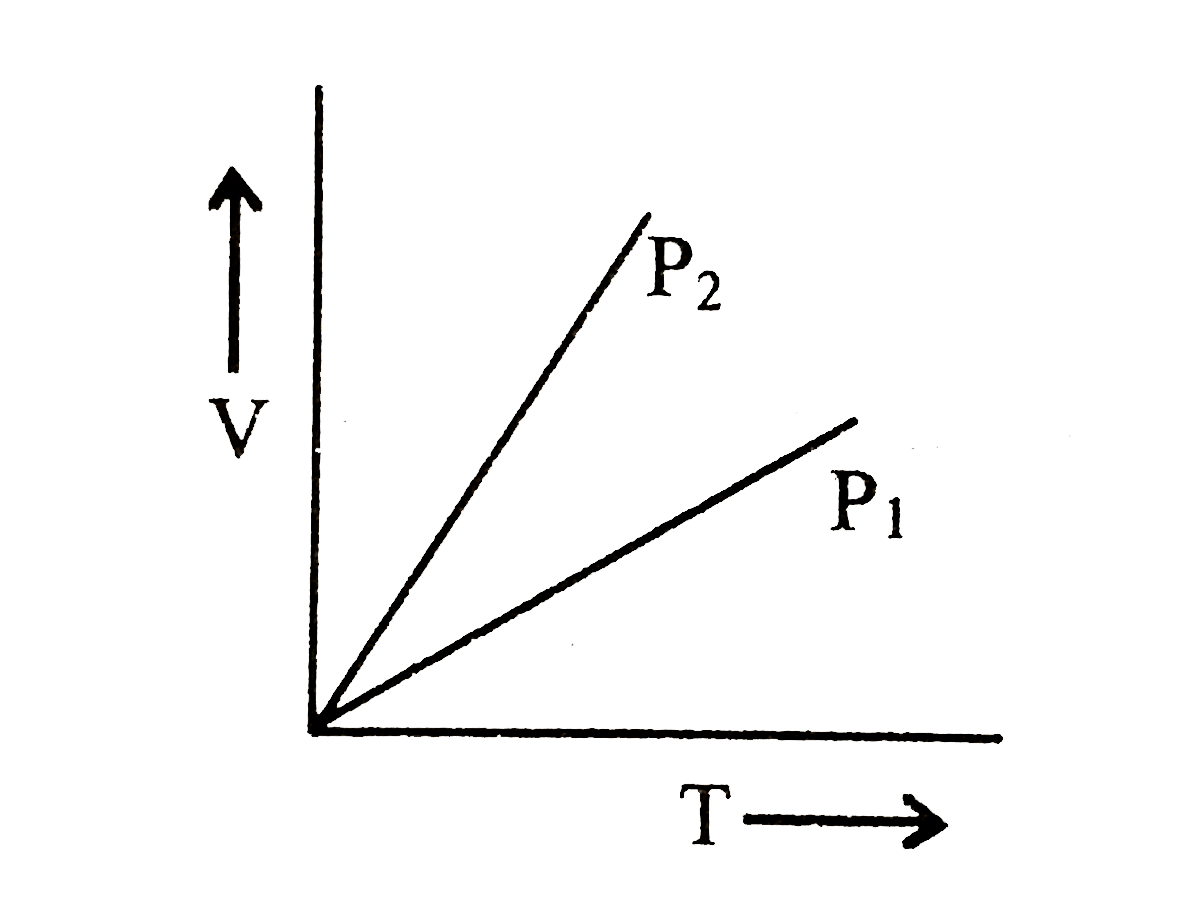
P1>P2
P1<P2
P1=P2
P1≥P2
The correct Answer is:A
Step by step video & image solution for For V versus T curves at constant pressure P_1 and P_2 for and ideal gas shown in figure- by Physics experts to help you in doubts & scoring excellent marks in Class 12 exams.
Updated on:21/07/2023Similar Questions
For V versus T curves at constant pressure P1andP2 for an ideal gas are shown in the figure given below
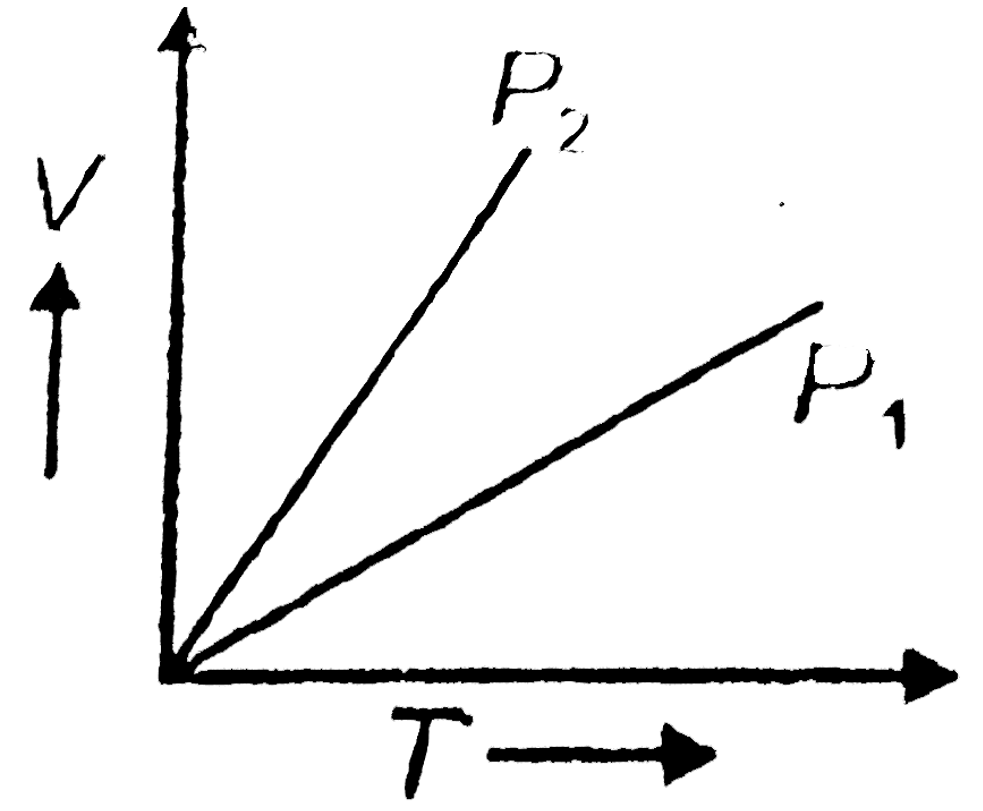
View SolutionV vs T curves at constant pressure P1 and P2 for an ideal gas are shown in the figure. Which of the following is correct?

View SolutionV vs T curves at constant pressure P1 and P2 for an ideal gas are shown below
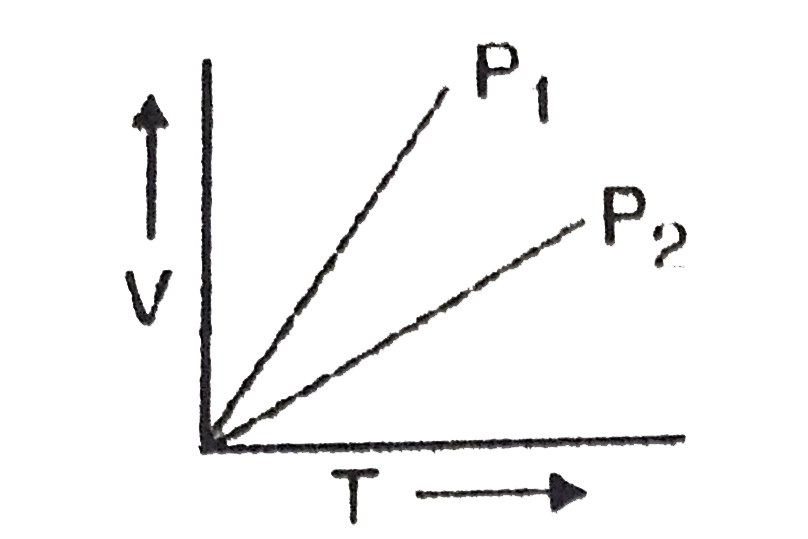
Which is correct ?
View SolutionV vs T curves at different pressures P1 and P2 for an ideal gas are shown below:

Which one of the following is correct?
View SolutionFor an ideal gas V−T curves at constant pressure P1 & P2 are shown in figure, from the figure
_E01_061_Q01.png)
View SolutionPressure versus density graph of an ideal gas is shown in figure
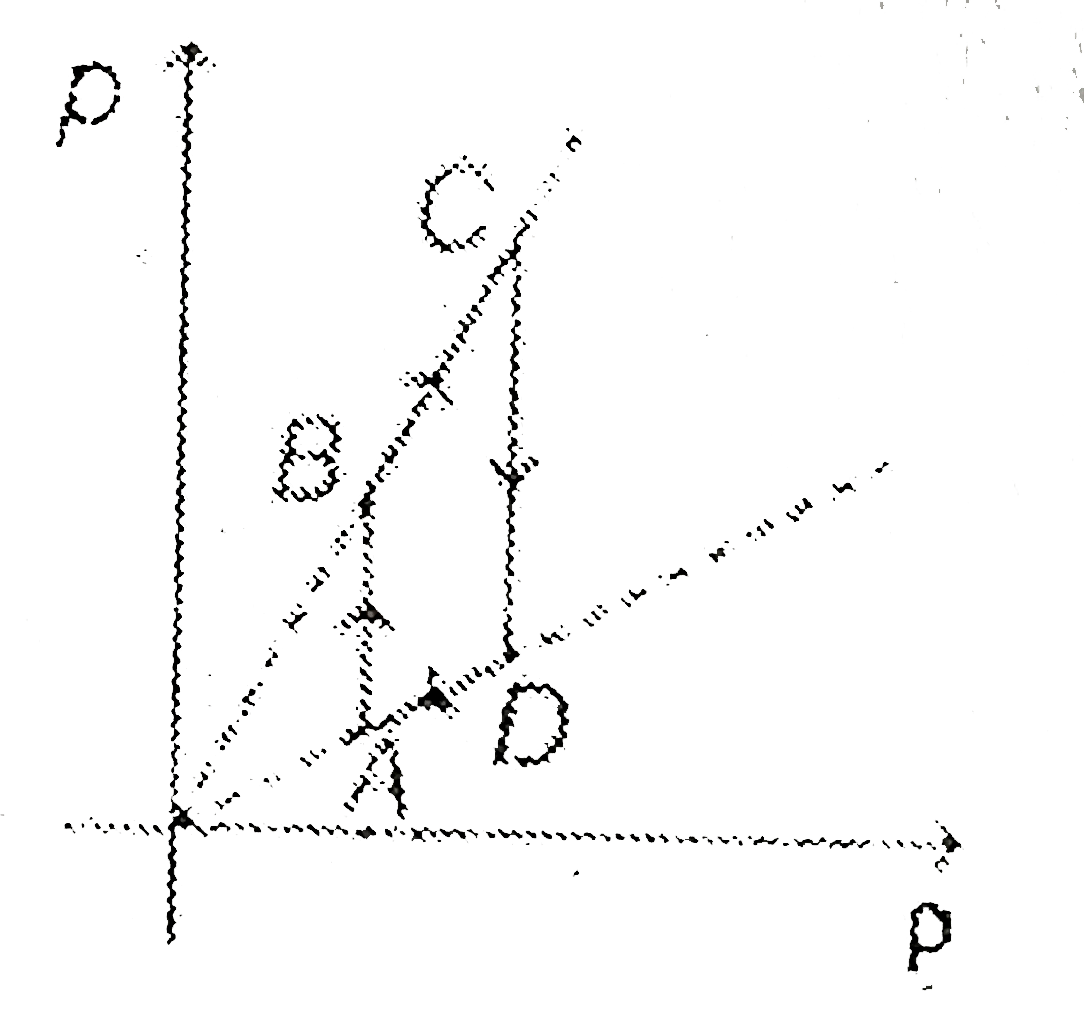
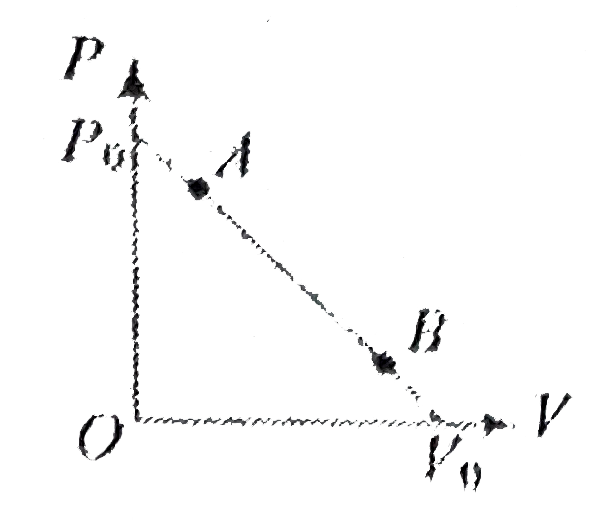
View SolutionA plot of P vs T for a given mass of gas at constant volume is a straight line . P vs T at constant volumes V1 and V2 for an ideal gas are shown below :
Which of the following is correct ?
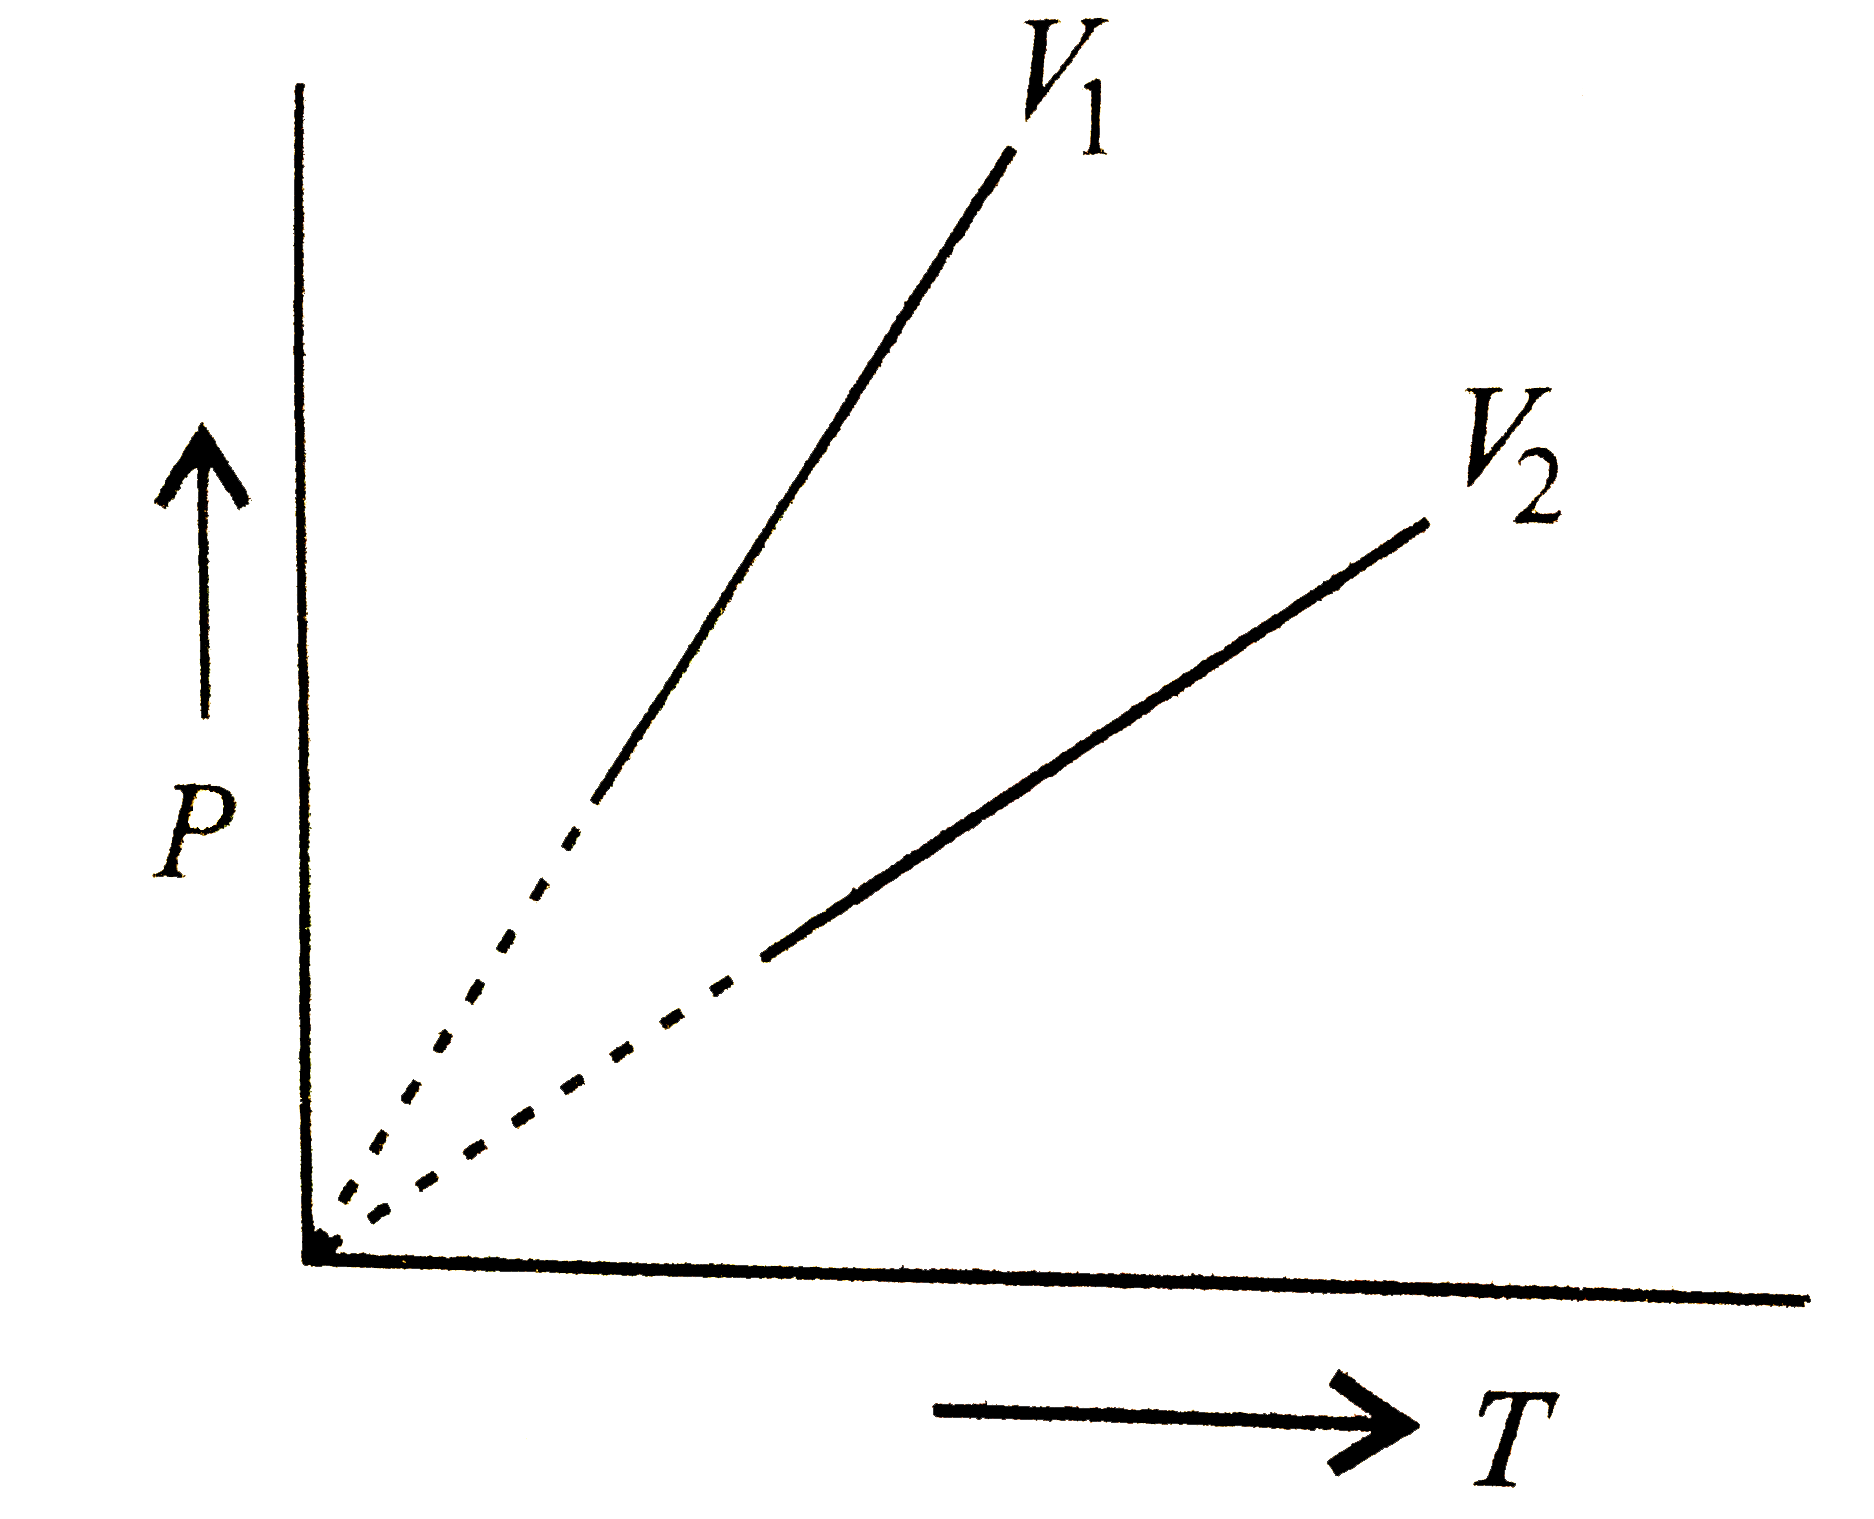
View SolutionWhat will be the work done on an ideal gas enclosed in a cyliner, when it is compressed by a constant external pressure, pext in a single step as shown in figure ? Explain graphically.
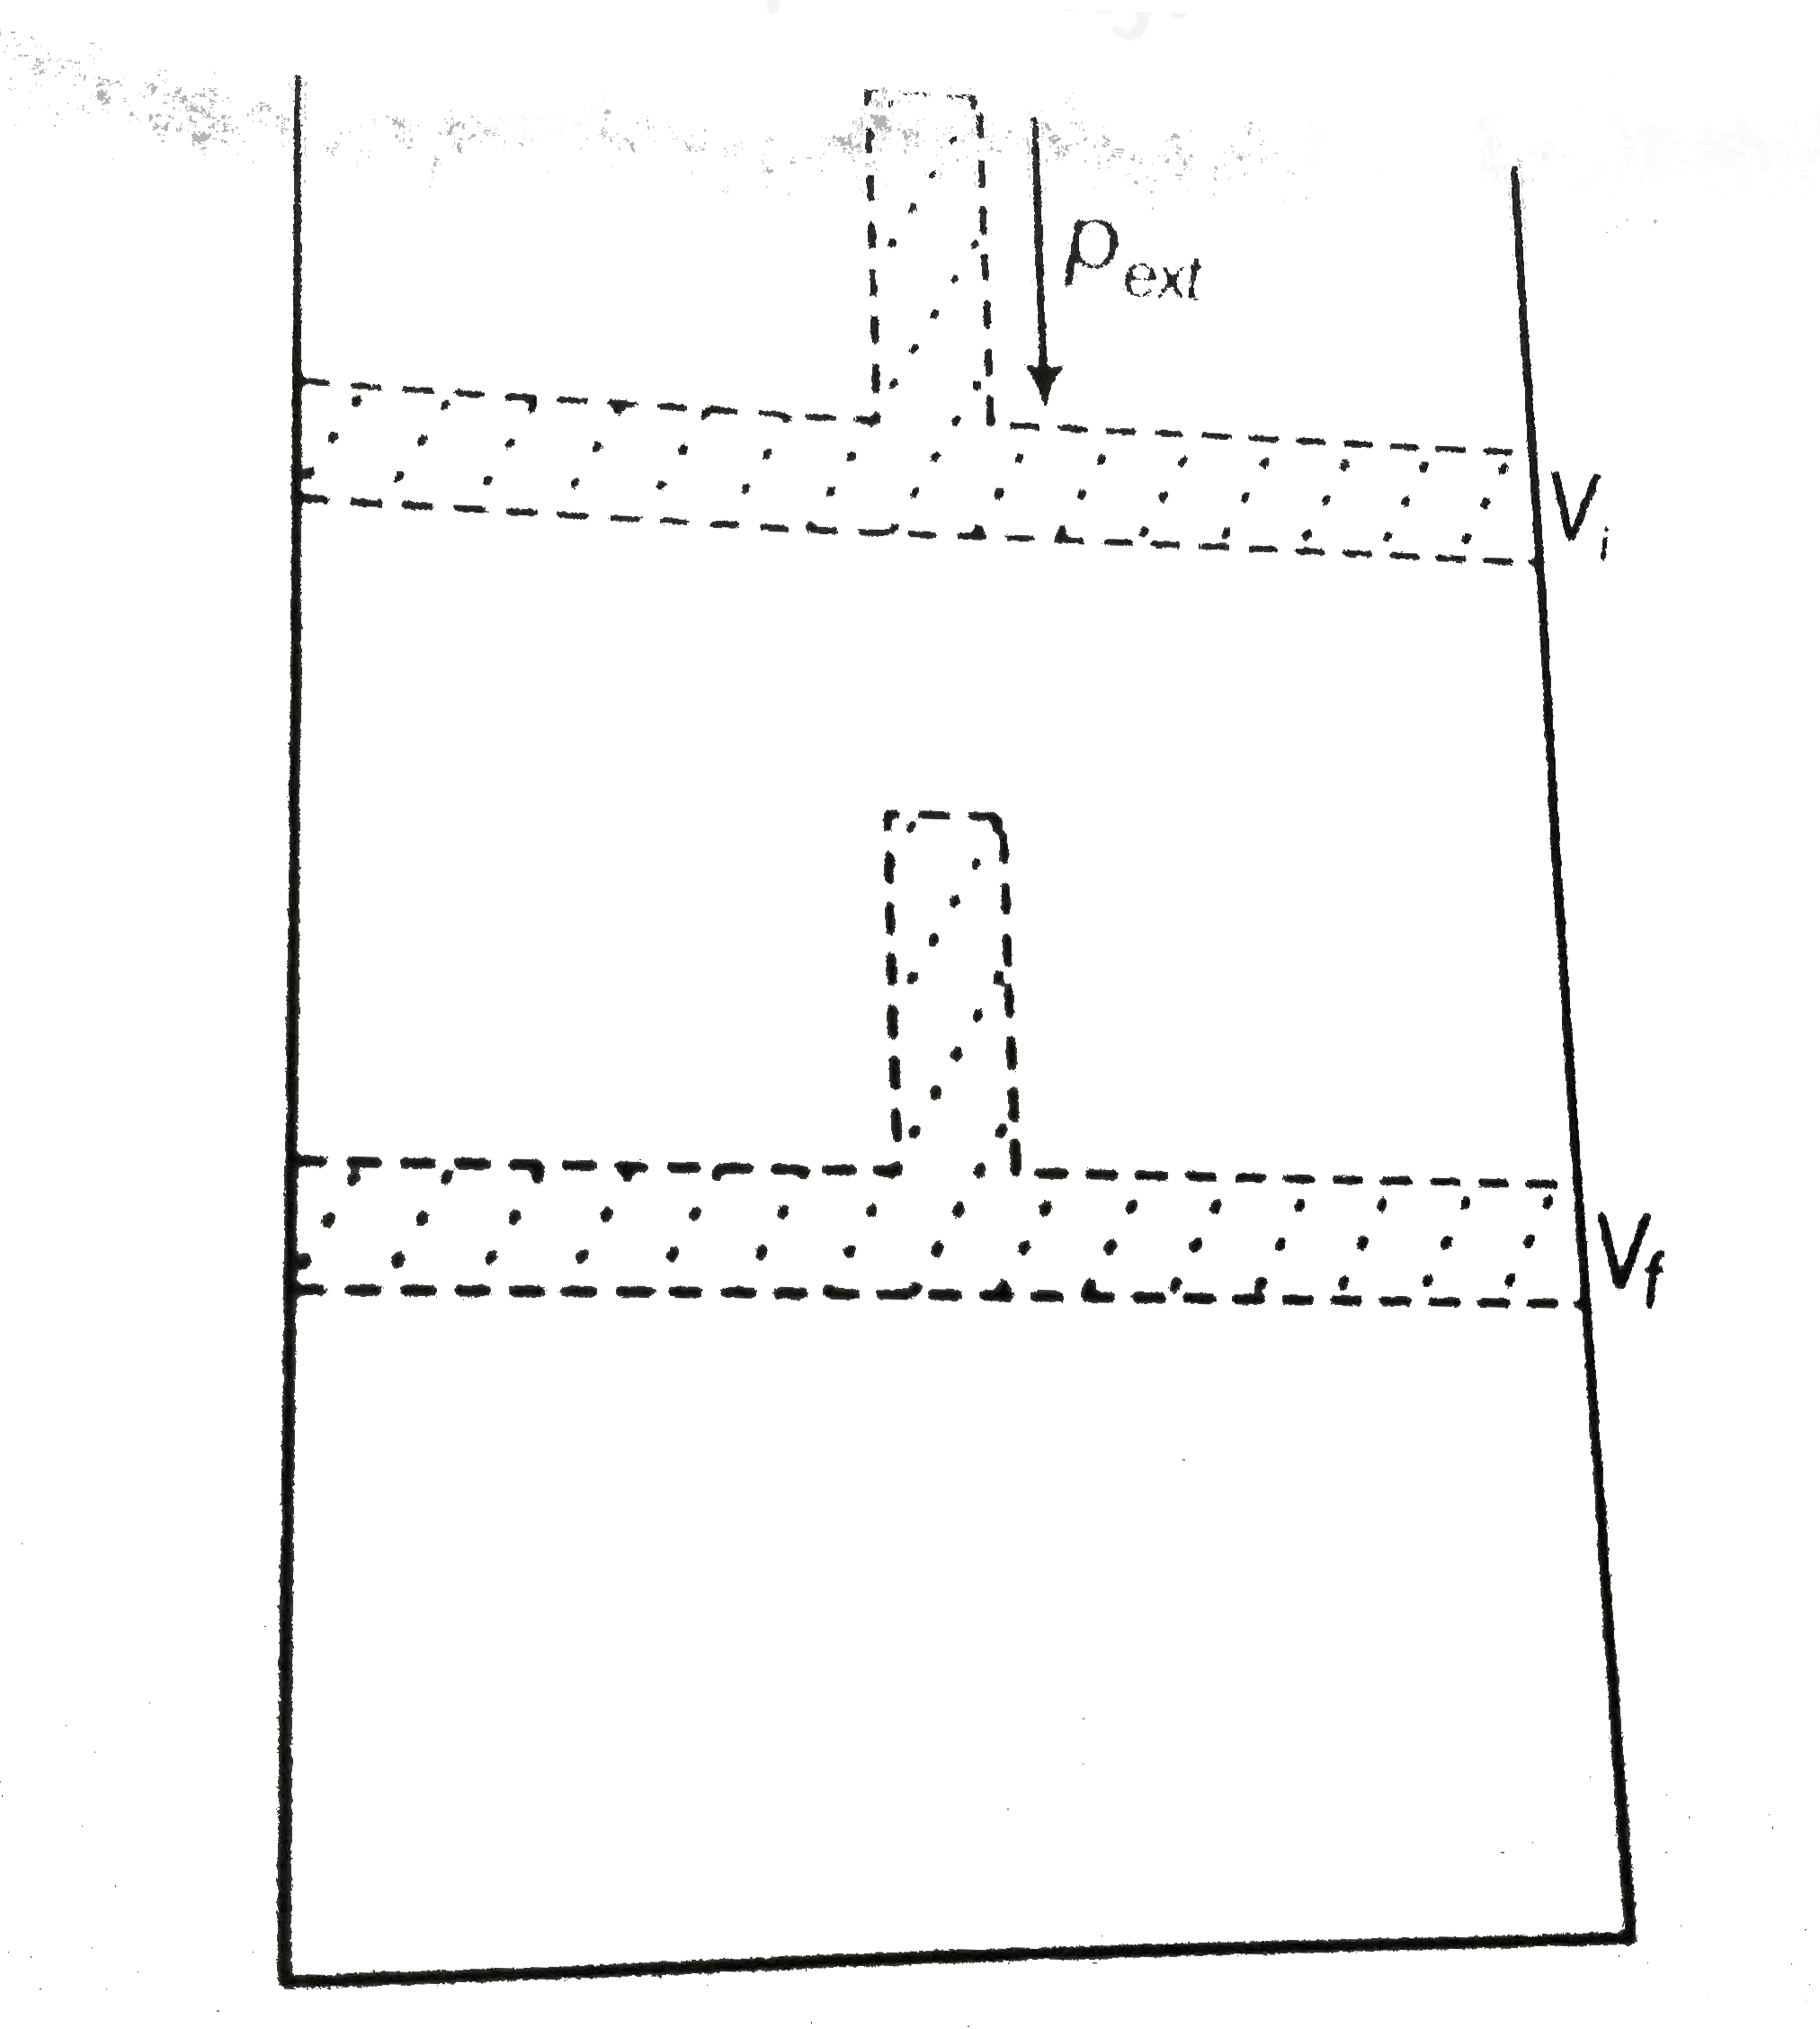
View SolutionOne mole of an ideal monatomic gas undergoes a linear process from A to B , in which is pressure P and its volume V change as shown in figure .
The absolute temperature T versus volume V for the given process is
View SolutionOne mole of an ideal monatomic gas undergoes a linear process from A to B , in which is pressure P and its volume V change as shown in figure .

The absolute temperature T versus volume V for the given process is
View Solution
