Assume that the nuclear binding energy per nucleon (B/A) versus mass number (A) is as shown in the figure. Use
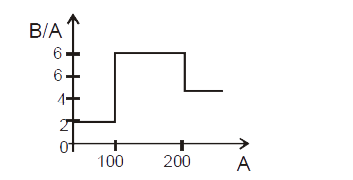
this plot to choose the correct choice(s) given below. Figure
Fusion of two nuclei with mass numbers lying in the range of 1<A<50 will release energy.
Fusion of two nuclei with mass numbers lying in the range of 51<A<100 will consume energy.
Fission of a nucleus lying in the mass range of 100<A<200 will release energy when broken into two equal fragments.
Fission of a nucleuw lying in the mass range of 200<A<260 will release energy when broken into two equal fragments.
The correct Answer is:D
Step by step video & image solution for Assume that the nuclear binding energy per nucleon (B/A) versus mass number (A) is as shown in the figure. Use this plot to choose the correct choice(s) given below. Figure by Physics experts to help you in doubts & scoring excellent marks in Class 12 exams.
Updated on:21/07/2023Similar Questions
Assume that the nuclear binding energy per nucleus(B/A) versus mass number (A) is as shown in the figure Use this plot to choose the correct (s) choice given below
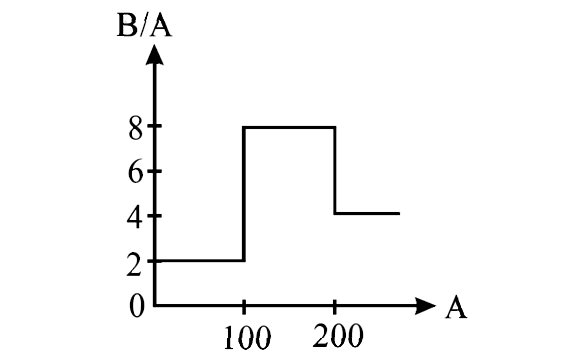
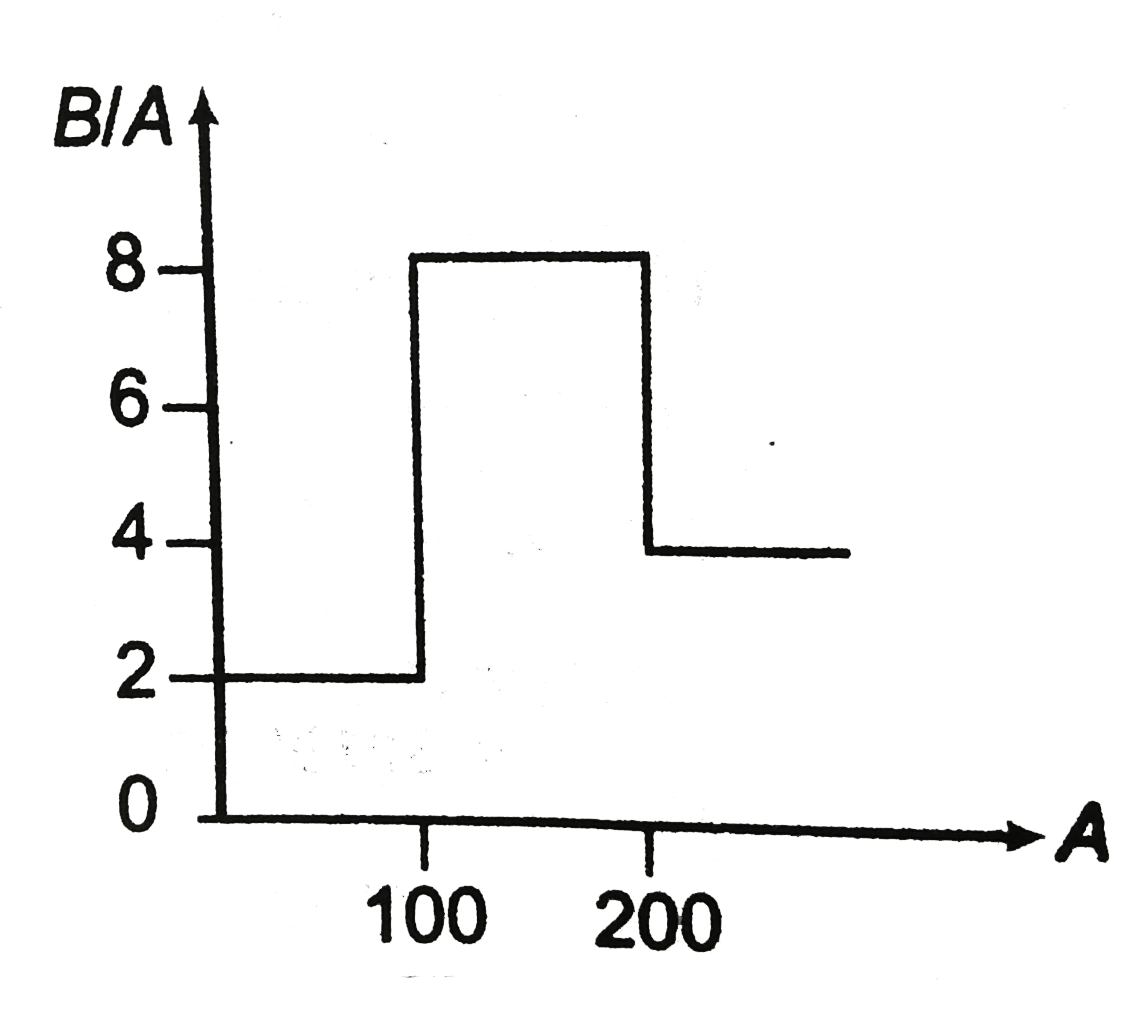
View SolutionAssume that the nuclear binding energy per nucleon (B/A) versus mass number (A) is as shown in figure. Use this plot to choose the correct choice(s) given below.
(a) Fusion of two nuclei with mass numbers, lying in the range of 1<A<50 will release energy.
Fusion of two nuclei with mass numbers lying in the range of 51<A<100 will release energy.
(c) Fission of a nucleus lying in the mass range of 100<A<200 will release energy when broken into two equal fragements.
(d) Fission of a nucleus lying in the mass range of 200<A<260 will release energy when broken into two equal fragments.
View SolutionAssume that the nuclear binding energy per nucleon (B/A) versus mass number (A) is drawn and is as shown in the figure. Consider a nucleus of A=110. Fission of the nucleus results into 2 fragments Then which of the following sets could be possibly the mass numbers of the resulting nuclei
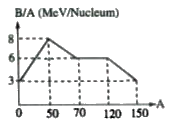
A) 55 and 55 B) 70 and 40
C) 100 and 10 D) 90 and 20
View SolutionThe graph between the binding energy per nucleon (E) and atomic mass number (A) is as-
View SolutionCircuit as shown in figure below, choose the correct statement

View SolutionFor the resistance network shown in the figure, choose the correct options (s)
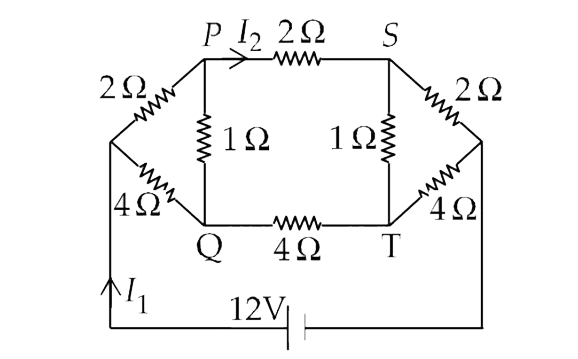
View SolutionAs the mass number A increases, the binding energy per nucleon in a nucleus.
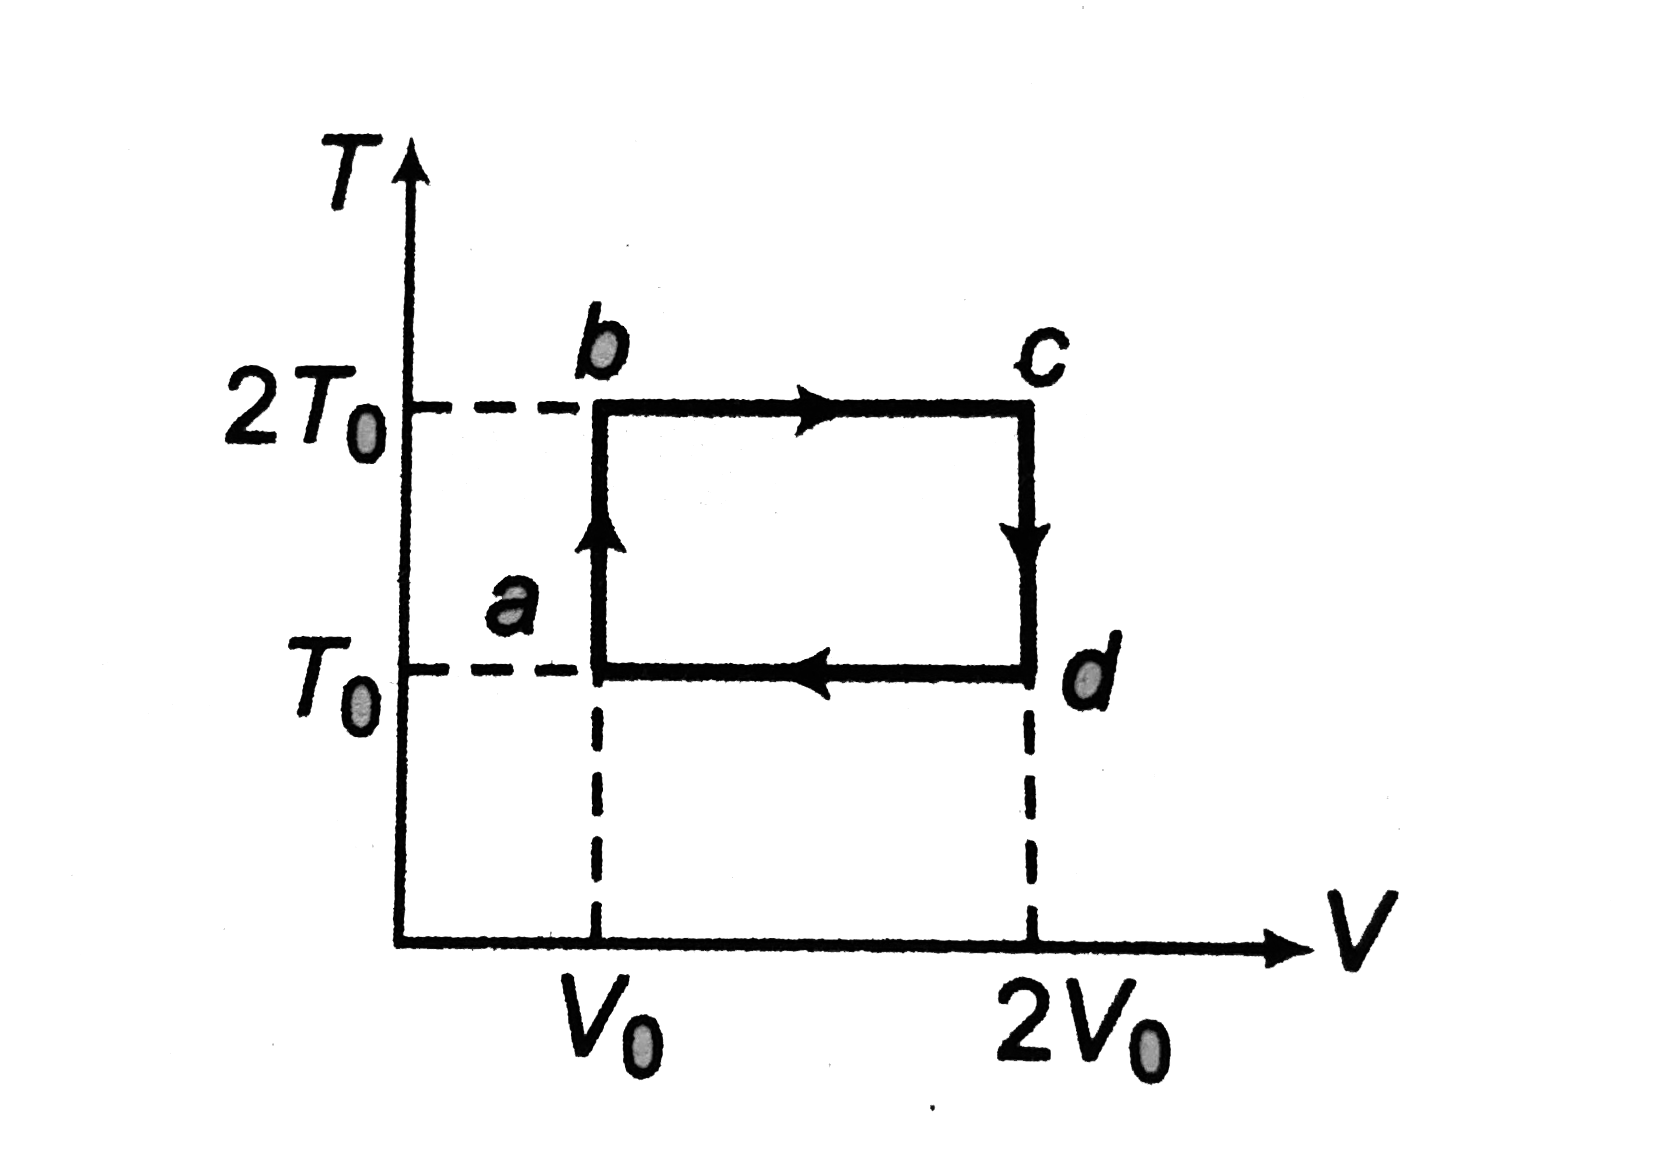
View SolutionT-V diagram of two moles of a monoatomic gas is as shown in figure.
For the process abcda choose the correct options given below
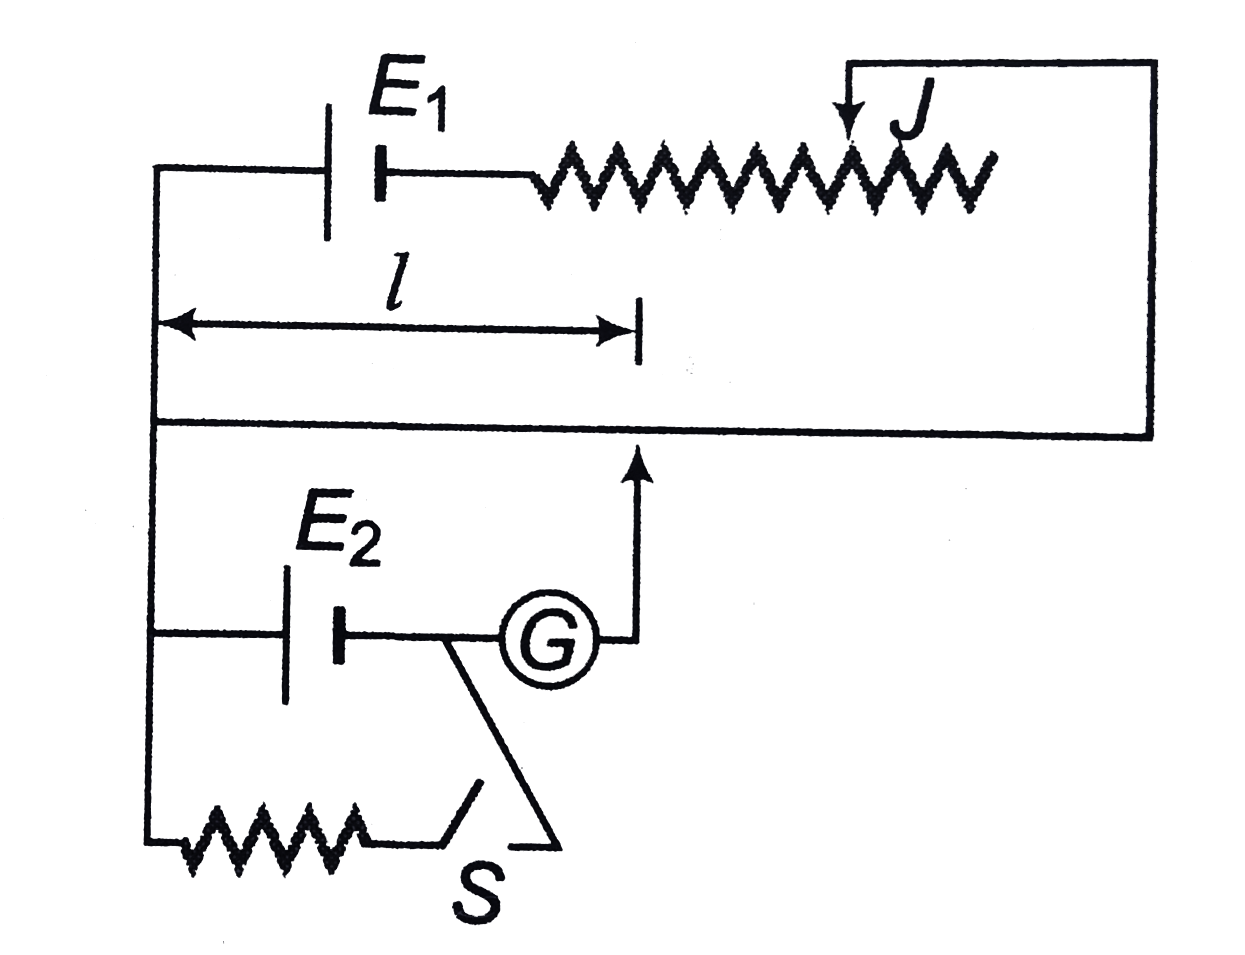
View SolutionIn the poteniometer experiement shown in figure, the null point length is l. Choose the correct options given below
View SolutionThe dependence of binding energy per nucleon, BN on the mass number, A is represented by.
(a)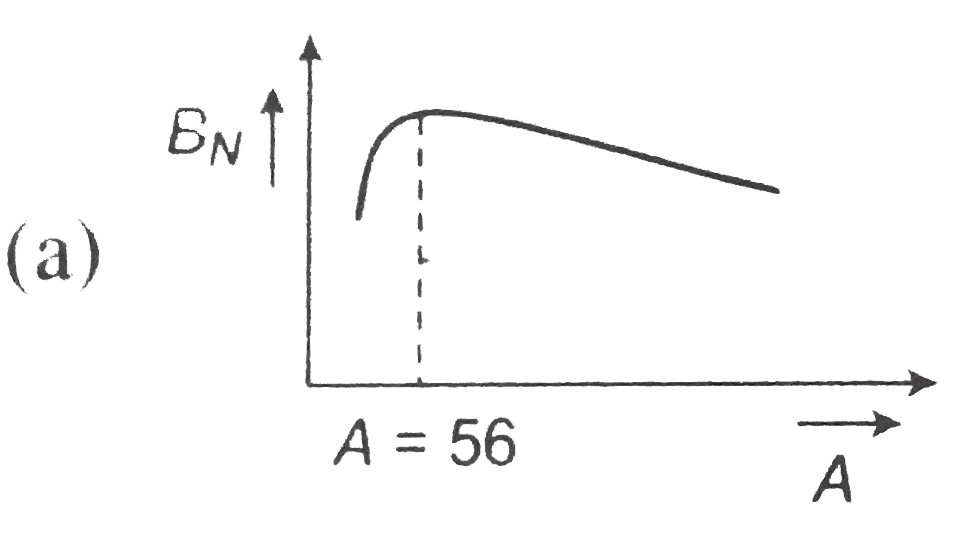 , (b)
, (b) 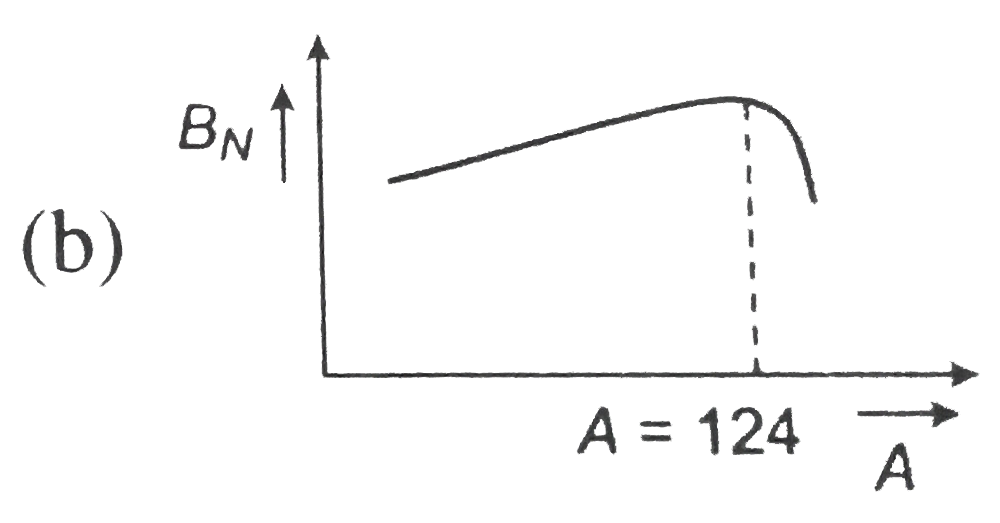 ,
,
( c)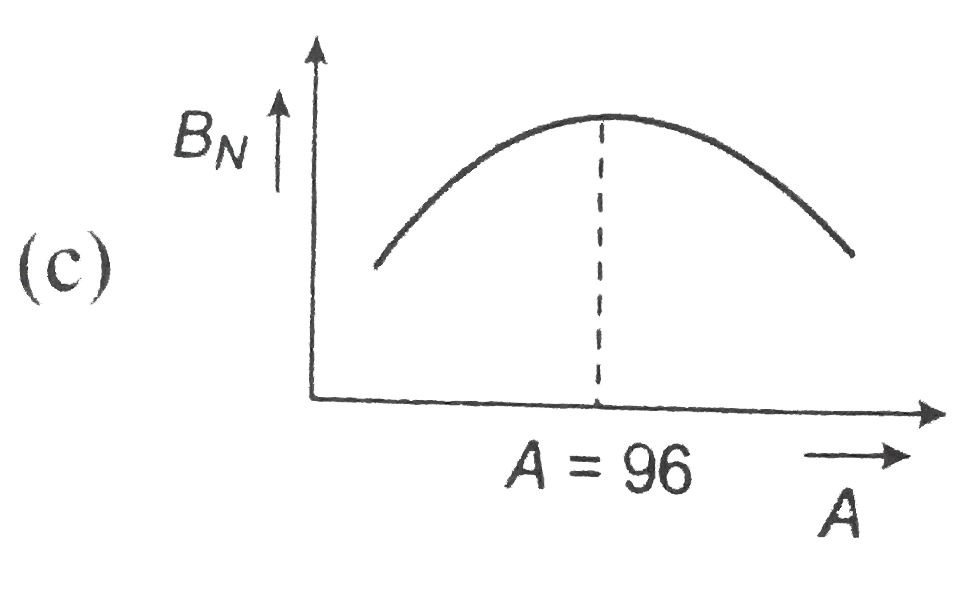 , (d)
, (d) 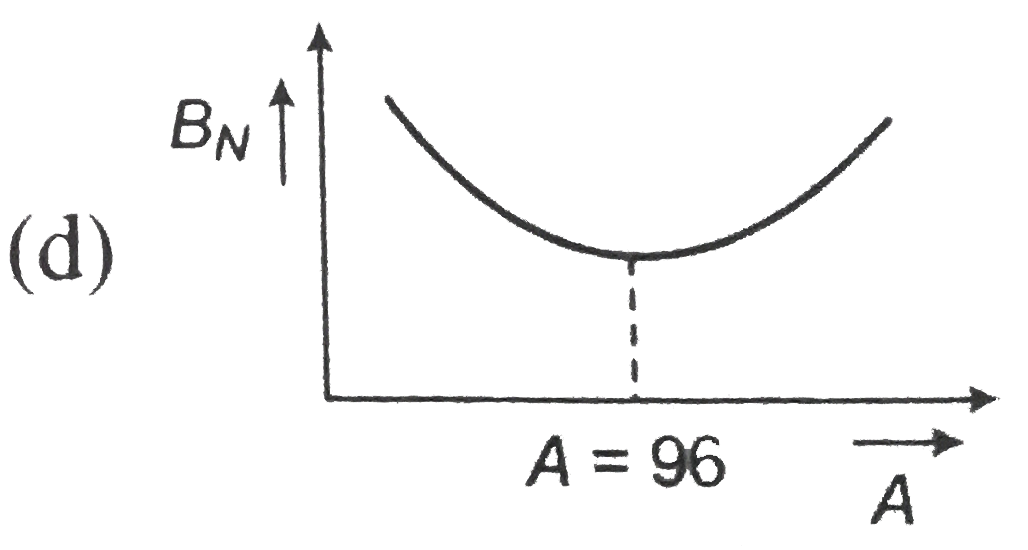 .
.
View Solution
