Which one of the following is the correct plot of ∧m(in s cm2mol−1)and√c⎛⎝in(molL)12⎞⎠ for KCl solution ? (y=∧m,x=√c)
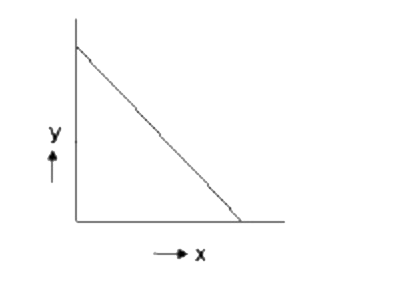
The correct Answer is:B
To solve the question regarding the correct plot of molar conductance (λm) versus the square root of concentration (√C) for KCl solution, we will follow these steps:
Step 1: Understand the relationship
The relationship between molar conductance (λm) and concentration (C) for strong electrolytes can be described by the Debye-Hückel-Onsager equation:
λm=λ0m−b√C
where:
- λm is the molar conductance at a given concentration,
- λ0m is the molar conductance at infinite dilution,
- b is a constant (Debye constant),
- C is the concentration.
Step 2: Rearranging the equation
From the equation, we can identify that:
- The y-axis will represent λm,
- The x-axis will represent √C.
This can be rewritten in the form of a linear equation:
y=mx+c
where:
- y=λm,
- m=−b (the slope, which is negative),
- x=√C,
- c=λ0m (the y-intercept).
Step 3: Analyze the plot characteristics
Given that the slope (m) is negative, the plot will show a downward trend as we move along the x-axis (increasing √C). The y-intercept will be positive, indicating that at zero concentration, the molar conductance approaches λ0m.
Step 4: Evaluate the options
Now, we need to evaluate the provided options based on the characteristics of the plot:
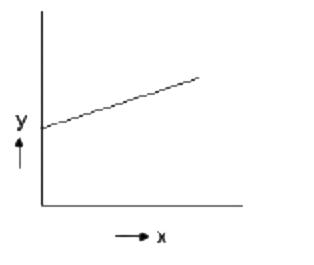
1. Option 1: Slope is not negative (incorrect).
2. Option 2: Slope is negative and there is a y-intercept (correct).
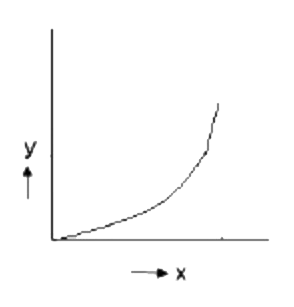
3. Option 3: Slope is not negative (incorrect).
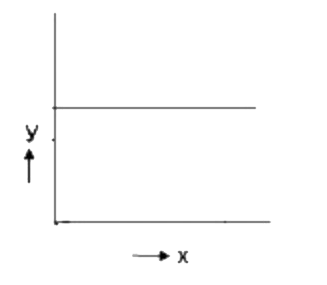
4. Option 4: Slope is not negative (incorrect).
Conclusion
The correct plot for the relationship between molar conductance and the square root of concentration for KCl solution is represented by Option 2, which shows a negative slope and a positive y-intercept.
---
The relationship between molar conductance (λm) and concentration (C) for strong electrolytes can be described by the Debye-Hückel-Onsager equation:
λm=λ0m−b√C
where:
- λm is the molar conductance at a given concentration,
- λ0m is the molar conductance at infinite dilution,
- b is a constant (Debye constant),
- C is the concentration.
From the equation, we can identify that:
- The y-axis will represent λm,
- The x-axis will represent √C.
y=mx+c
where:
- y=λm,
- m=−b (the slope, which is negative),
- x=√C,
- c=λ0m (the y-intercept).
Given that the slope (m) is negative, the plot will show a downward trend as we move along the x-axis (increasing √C). The y-intercept will be positive, indicating that at zero concentration, the molar conductance approaches λ0m.
Now, we need to evaluate the provided options based on the characteristics of the plot:
1. Option 1: Slope is not negative (incorrect).
2. Option 2: Slope is negative and there is a y-intercept (correct).
3. Option 3: Slope is not negative (incorrect).
4. Option 4: Slope is not negative (incorrect).
The correct plot for the relationship between molar conductance and the square root of concentration for KCl solution is represented by Option 2, which shows a negative slope and a positive y-intercept.
Similar Questions
Knowledge Check
- Question 1 - Select One
Which of the following curve gives the variation of Λmwith√C for CH3COOH ?
A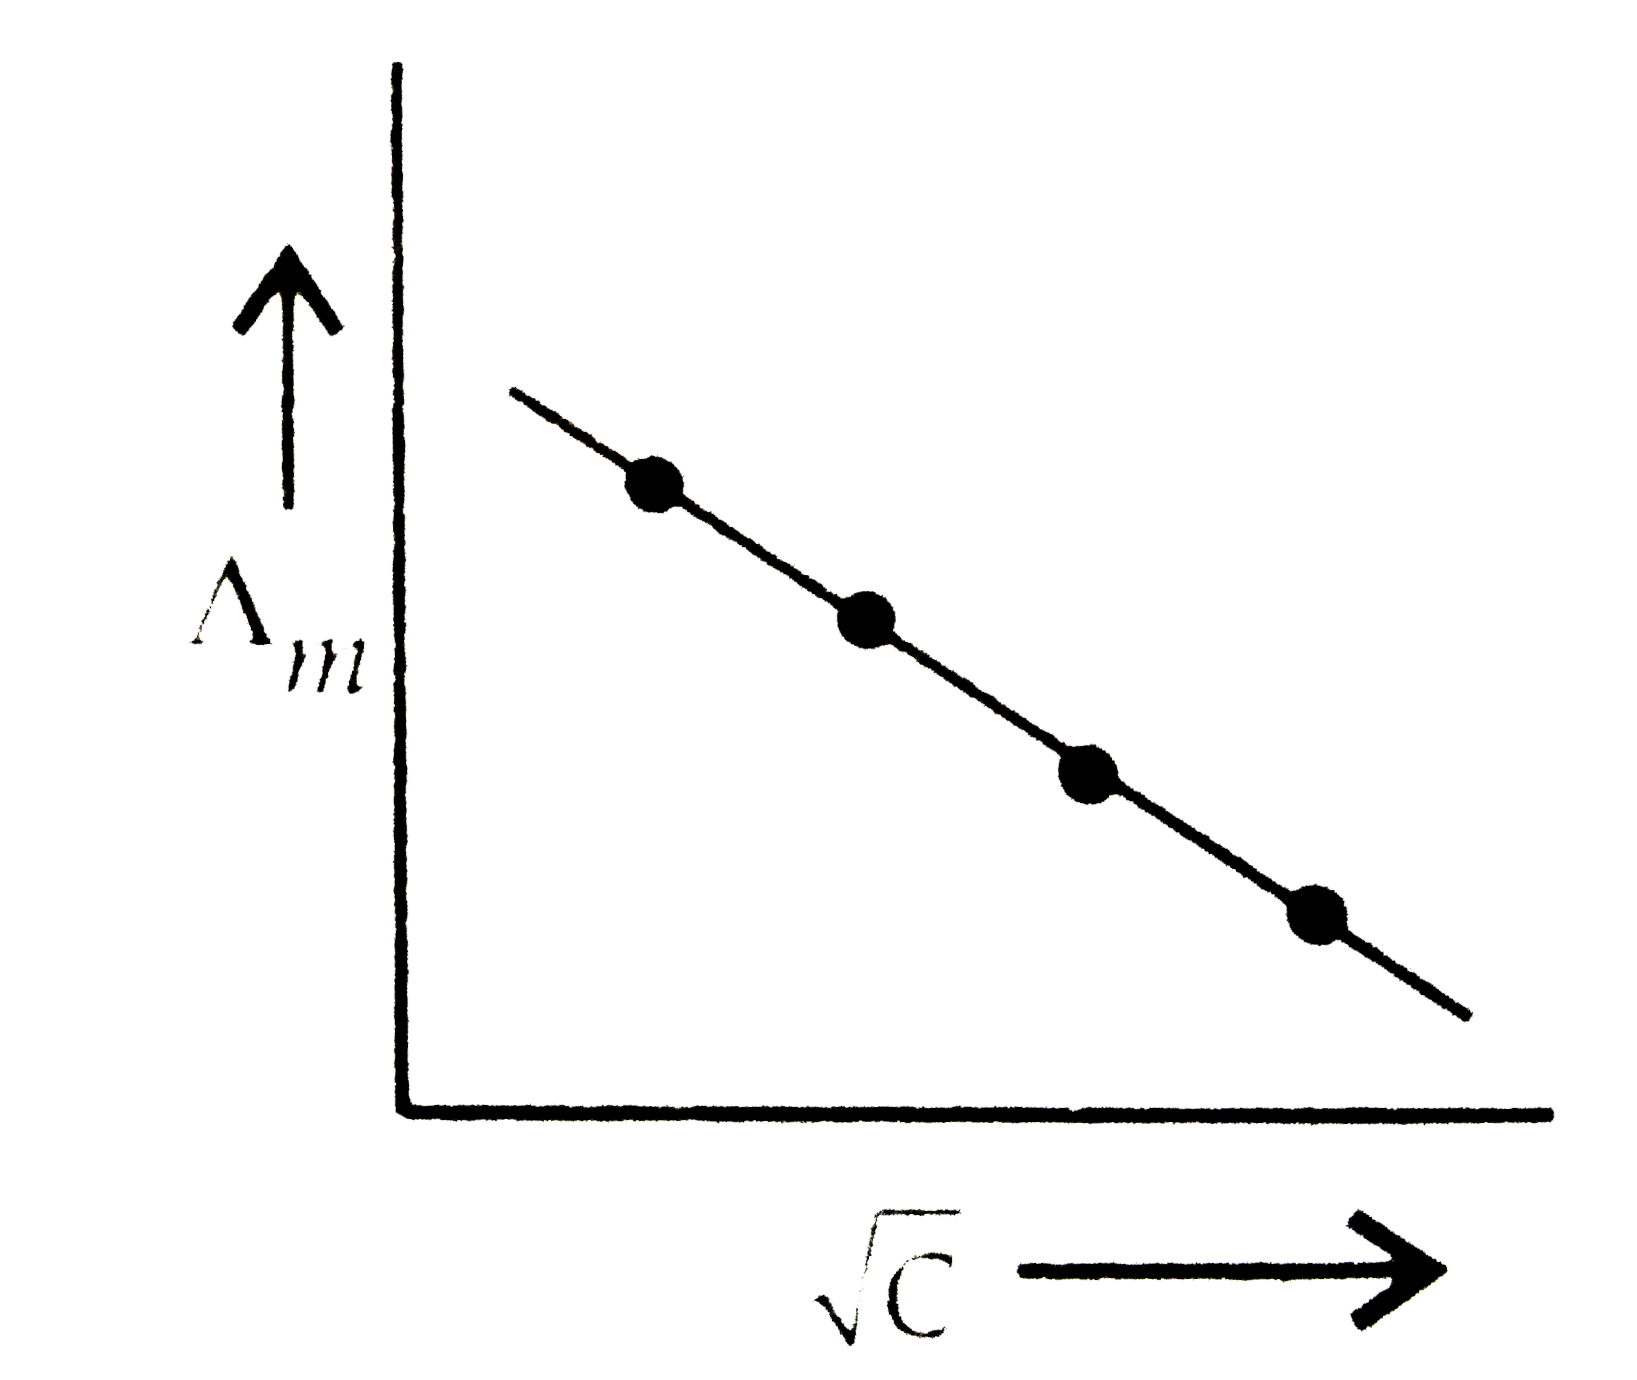 B
B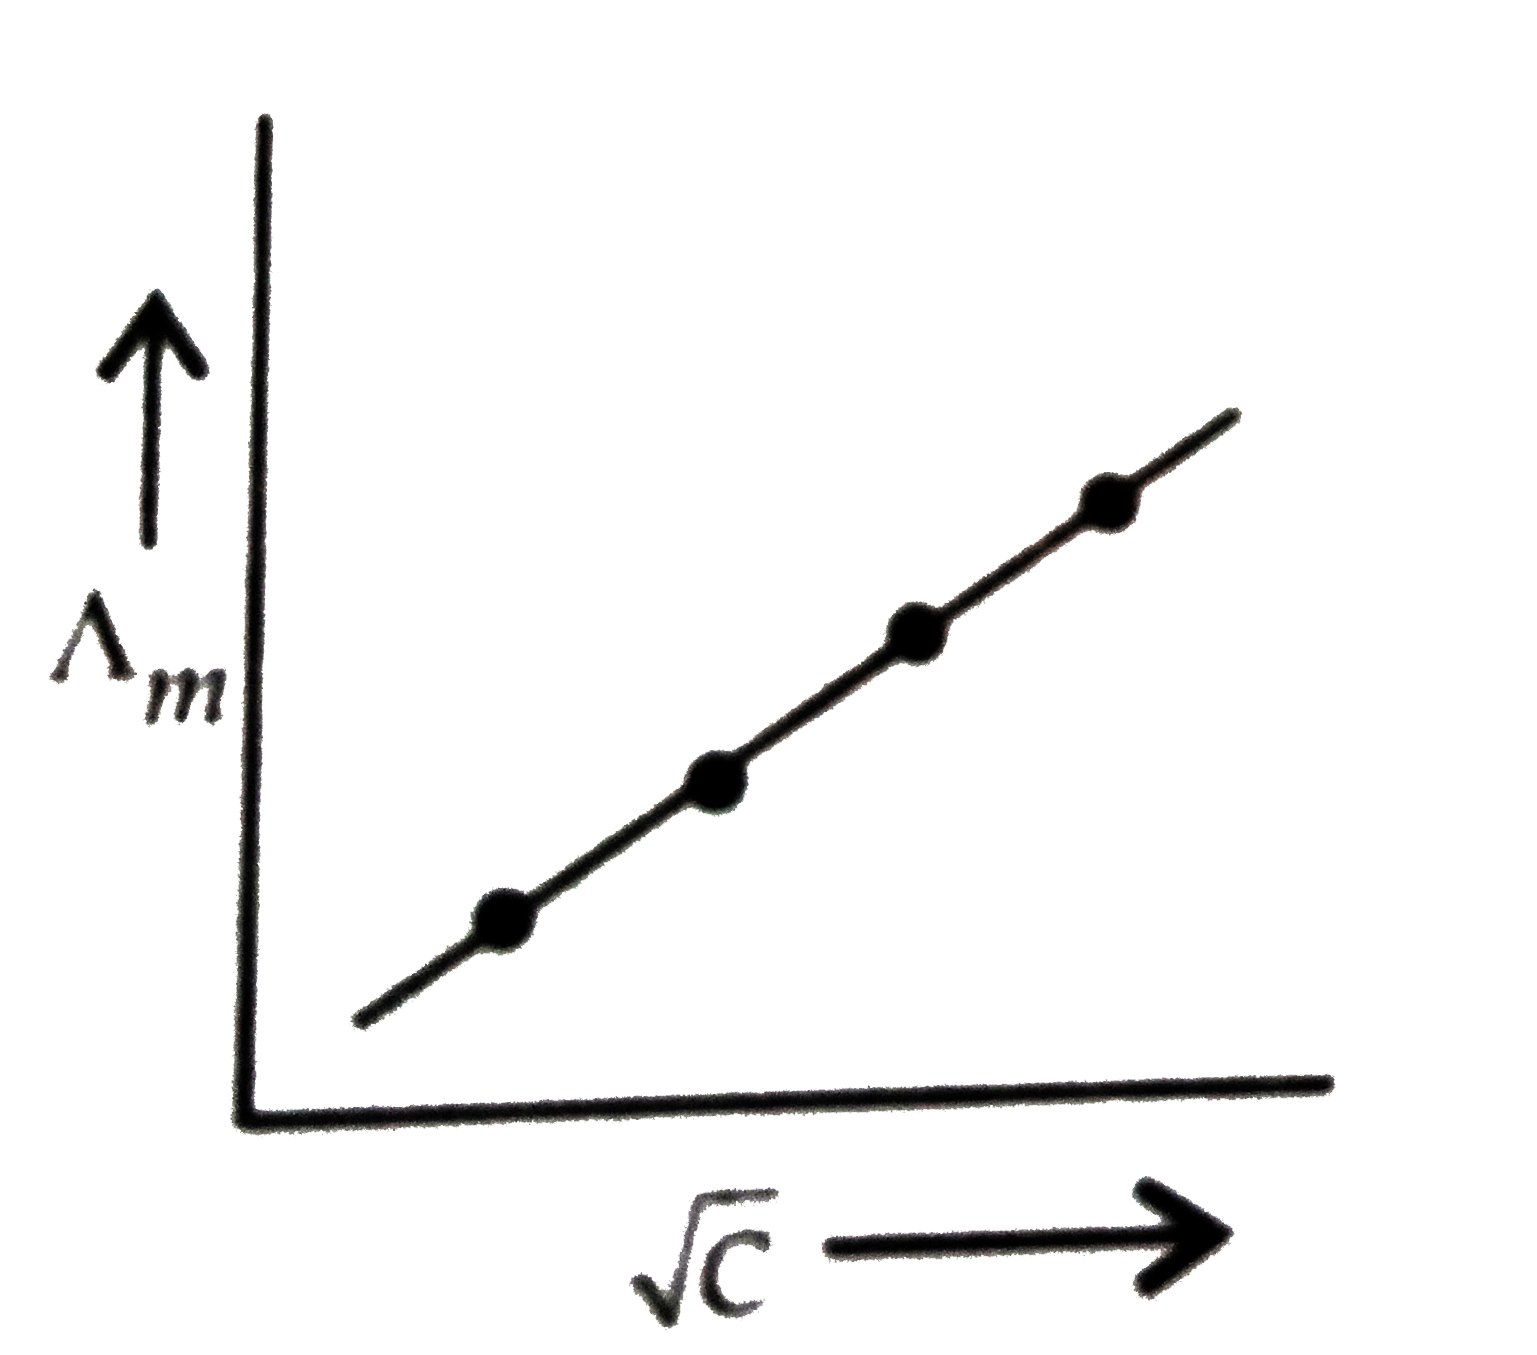 C
C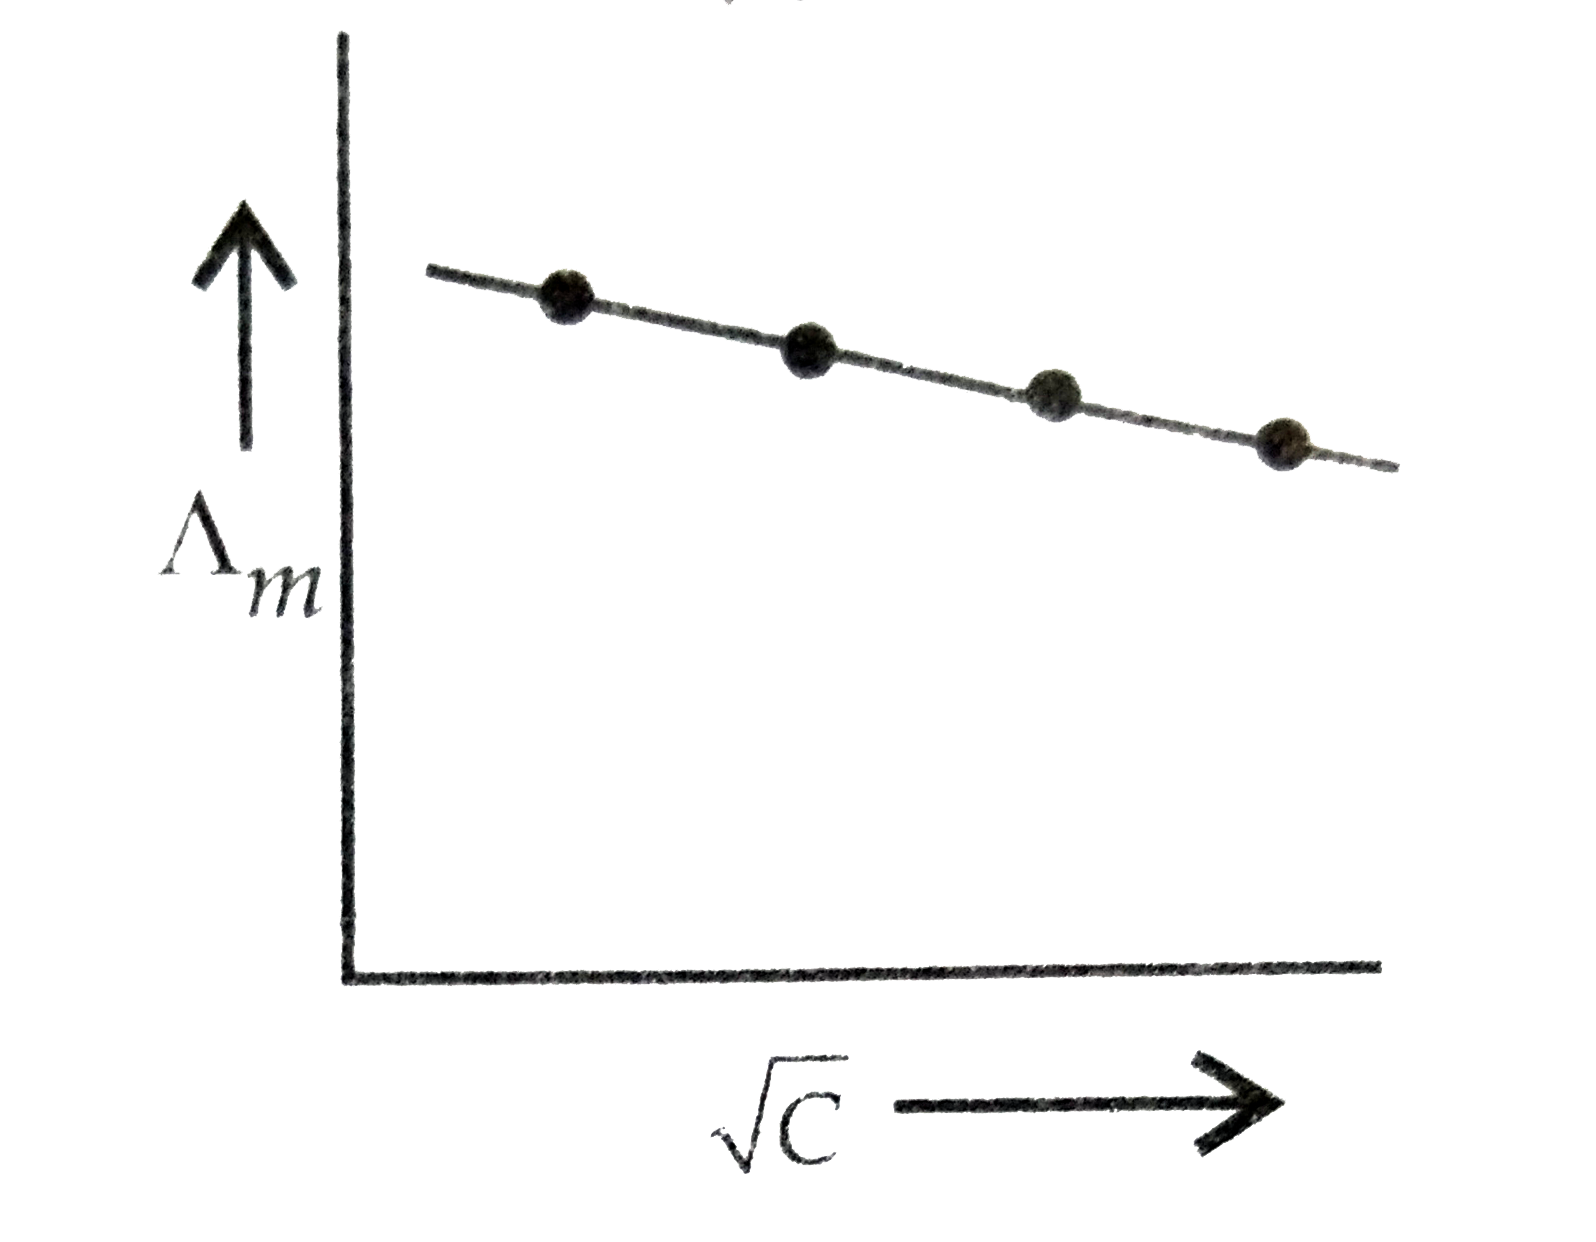 DNone of these
The resistance of 0.5M solution of an electrolyte in a cell was found to be 50Ω. If the electrodes in the cell are 2.2cm apart and have an area of 4.4cm2 then the molar conductivity (in Sm2mol−1) of the solution is
View SolutionIf X is specific resistance of the electrolytic solution and Y is the molarity of the solution then molar conductivity of solution is (in Scm2mol−1) given by:
View SolutionThe concentrations of N2O5 decomposing in first order kinetics after 800 s is 1.45molL−1 and after 1600 s is 0.88molL−1. Calculate the rate constant.
View SolutionMolar conductance of 1M solution of weak acid HA is 20 ohm−1cm2mol−1. Find % dissocation of HA:
(∧om(H+)=350Scm2mol−1),(∧om(A−)=50Scm2mol−1)View Solution(a) Define the following terms :
(i) Limiting molar conductivity,
(ii) Fuel cell
(b) Resistance of a conductivity cell filled with 0.1molL−1KCl solution is 100 Ohm. If the resistance of the same cell when filled with 0.2molL−1KCl solution is 520 Ohm , calculate the conductivity and molar conductivity of 0.2molL−1KCl solution. The conductivity of 0.1molL−1KCl solution is 1.29×10⁻¹Scm−1 .View SolutionFor the reaction, 2A + B → products, when the concentrations of A and B both were doubled, the rate of the reaction increased from 0.3 mol L−1s−1 to 2.4 mol L−1s−1. When the concentration of A alone is doubled, the rate increased from 0.3 mol L−1s−1 to 0.6 mol L−1s−1.
Which one of the following statements is correct ?View SolutionExplain , giving reason , which of the following sets of quantum number are not possible an=0l=0m1=0ms=+1/2bn=1l=0m1=0ms=−1/2cn=1l=1m1=0ms=+1/2dn=2l=1m1=0ms=−1/2en=3l=3m1=−3ms=+1/2fn=3l=1m1=0ms=+1/2
View Solution

