The graph given below represents the effect of sewage discharge of some important characteristics of river
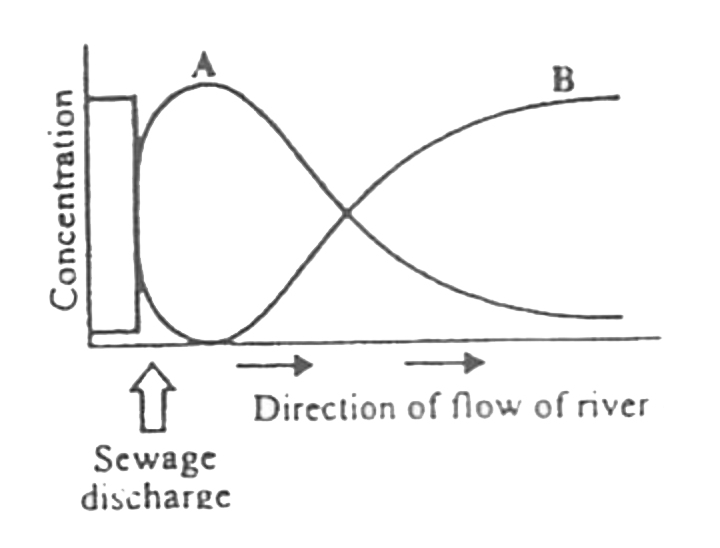
Select the CORRECT option with respect to peaks A and B.
Peak A - Sharp increase in BOD , the disappearance of clean water organisms
Peak B - In crease in dissolved oxygen , the reappearance of clean water organisms.
Peak A - Increase in dissolved oxygen , the reappearance of clean water organisms.
Peak B - Sharp decline in dissolved oxygen , the disappearance of clean water organisms.
Peak A - Sharp increase in BOD , the appearance of clean water organisms.
Peak B - Increases of clean water organisms.
Peak A - Increased number of anaerobic bacteria, the disappearance of clean water organisms.
Peak B. Sharp decline in dissolved O2 , the reappearance of clean water organisms
The correct Answer is:A
Step by step video & image solution for The graph given below represents the effect of sewage discharge of some important characteristics of river Select the CORRECT option with respect to peaks A and B. by Biology experts to help you in doubts & scoring excellent marks in Class 12 exams.
Updated on:21/07/2023Similar Questions
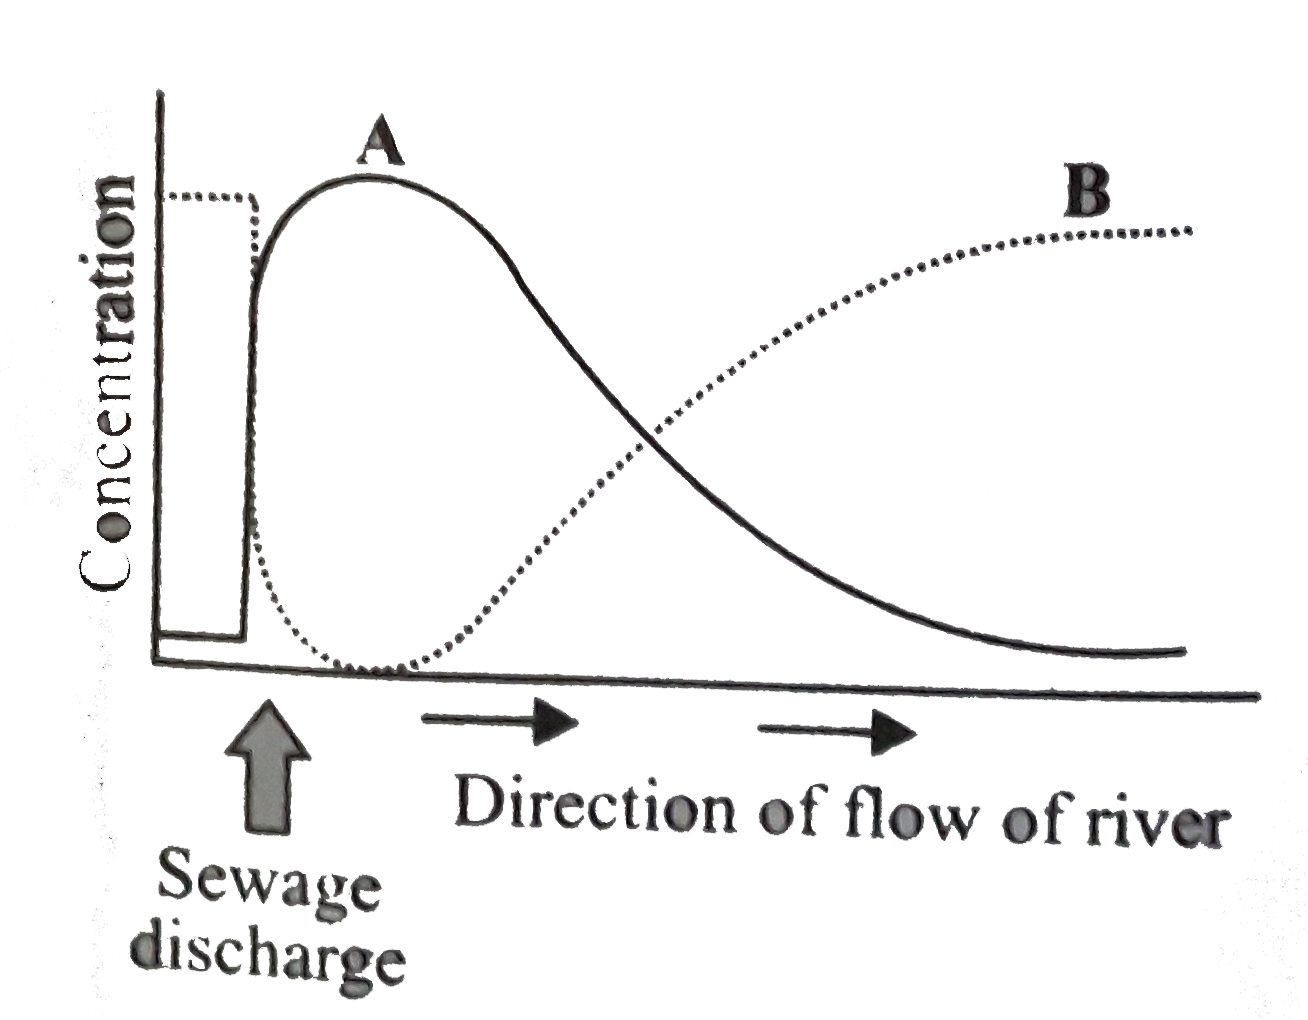
The graph given below represents the effect of sewage discharge on some important characteristics of river.
Select the correct option with respect to the peaks A and B.
View SolutionChoose the correct representation of effect of sewage discharge on important characteristics of a river.
View Solution
Knowledge Check
Explain the changes that can be observed in the characteristics of river water when sewage is discharged into it and a few weeks after the discharge with respect to :
(i) level of dissolved oxygen (ii) population of fresh water organisms.APeak A- Sharp increase in BOD, disappearance of clean water organisms
Peak B- Increase in dissolved oxygen, reappearance of clean water organismsBPeak A- Increase in dissolved oxygen, reappearance of cleanwater organisms
Peak B- Sharp increase in BOD, appearance of clean water organismsCPeak A- Sharp increase in BOD, appearance of clean water organisms
Peak B- Increased number in dissolved oxygen, disappearance of clean water organismsDPeak A- Increased number of anaerobic bacteria, disappearance of clean water organisms
Peak B- Sharp decline in dissolved O2, reappearance of clean water organismsIdentify the figures of the contraceptives given below and select the correct option
 A A B C DCondom Implant CuT Condom for maleB A B C DImplant CuT Condom for female Condom for maleC A B C DCondom for male CuT Implant Condom for femaleD A B C DCondom for male Implant CuT Condom for female
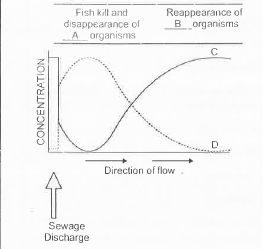
The given graph depicts the depicts the efect of sewage discharge on some important characteristics of a river. Select the correct label for A,B,C and D
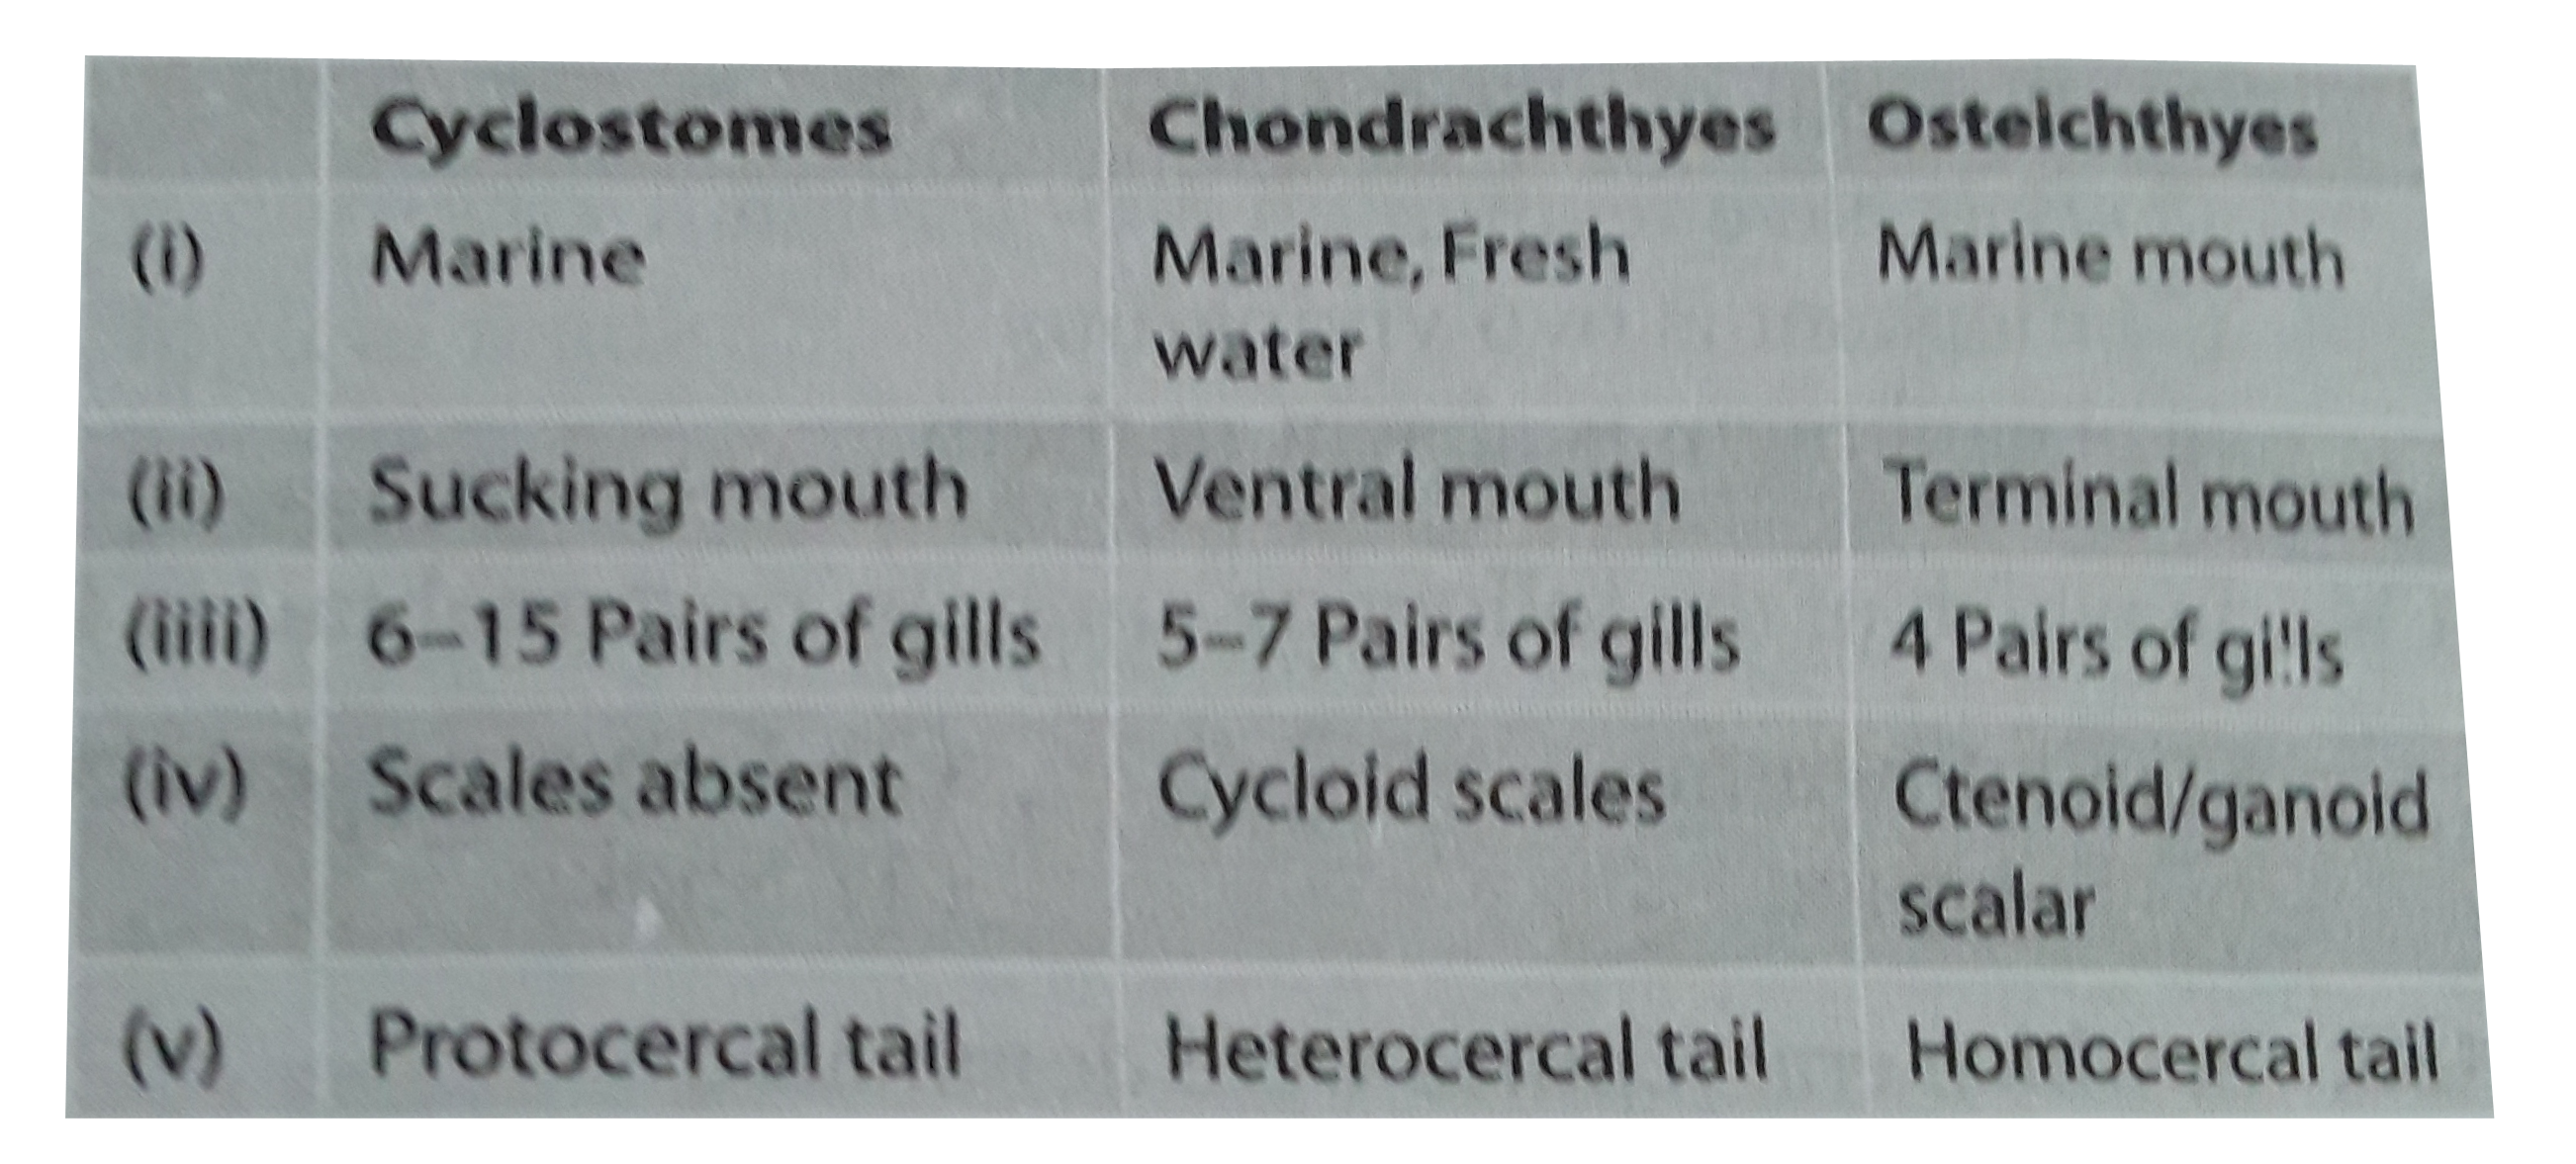
View SolutionSelect the correct option in respect of characteristics of each group :
View SolutionThe figure below represents the structure of the chromosome
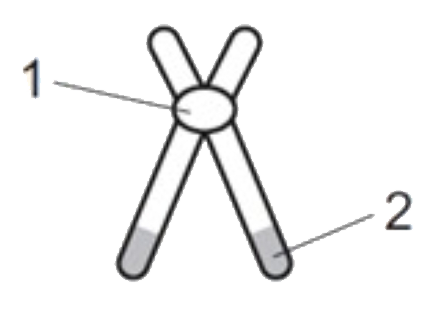
Select the correct option regarding the structure.
View SolutionExplain the effect on the characteristics of a river when urban sewage is discharged in to it.
View SolutionChoose the correct option with respect to the diagram given below .
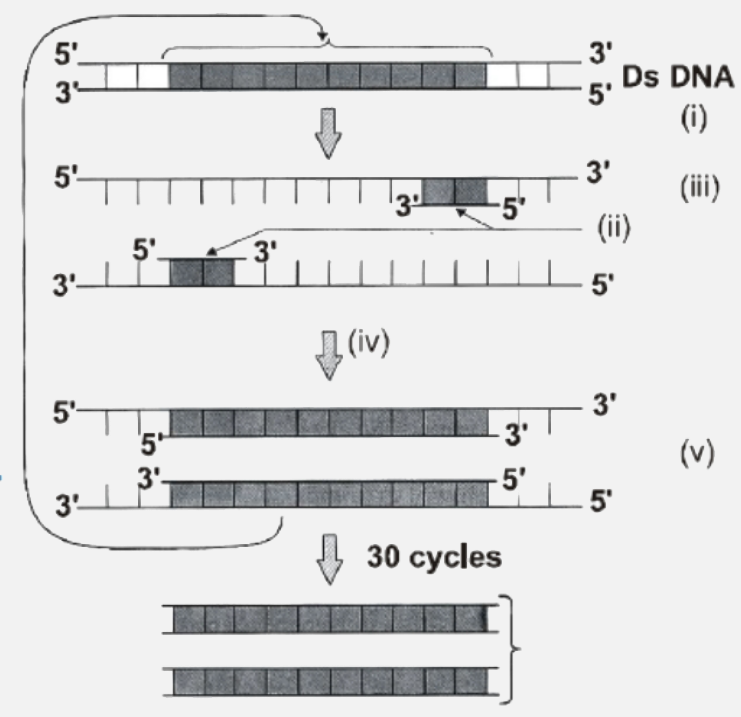
View SolutionIdentify the figure of the contraceptive given below and select the correct option :
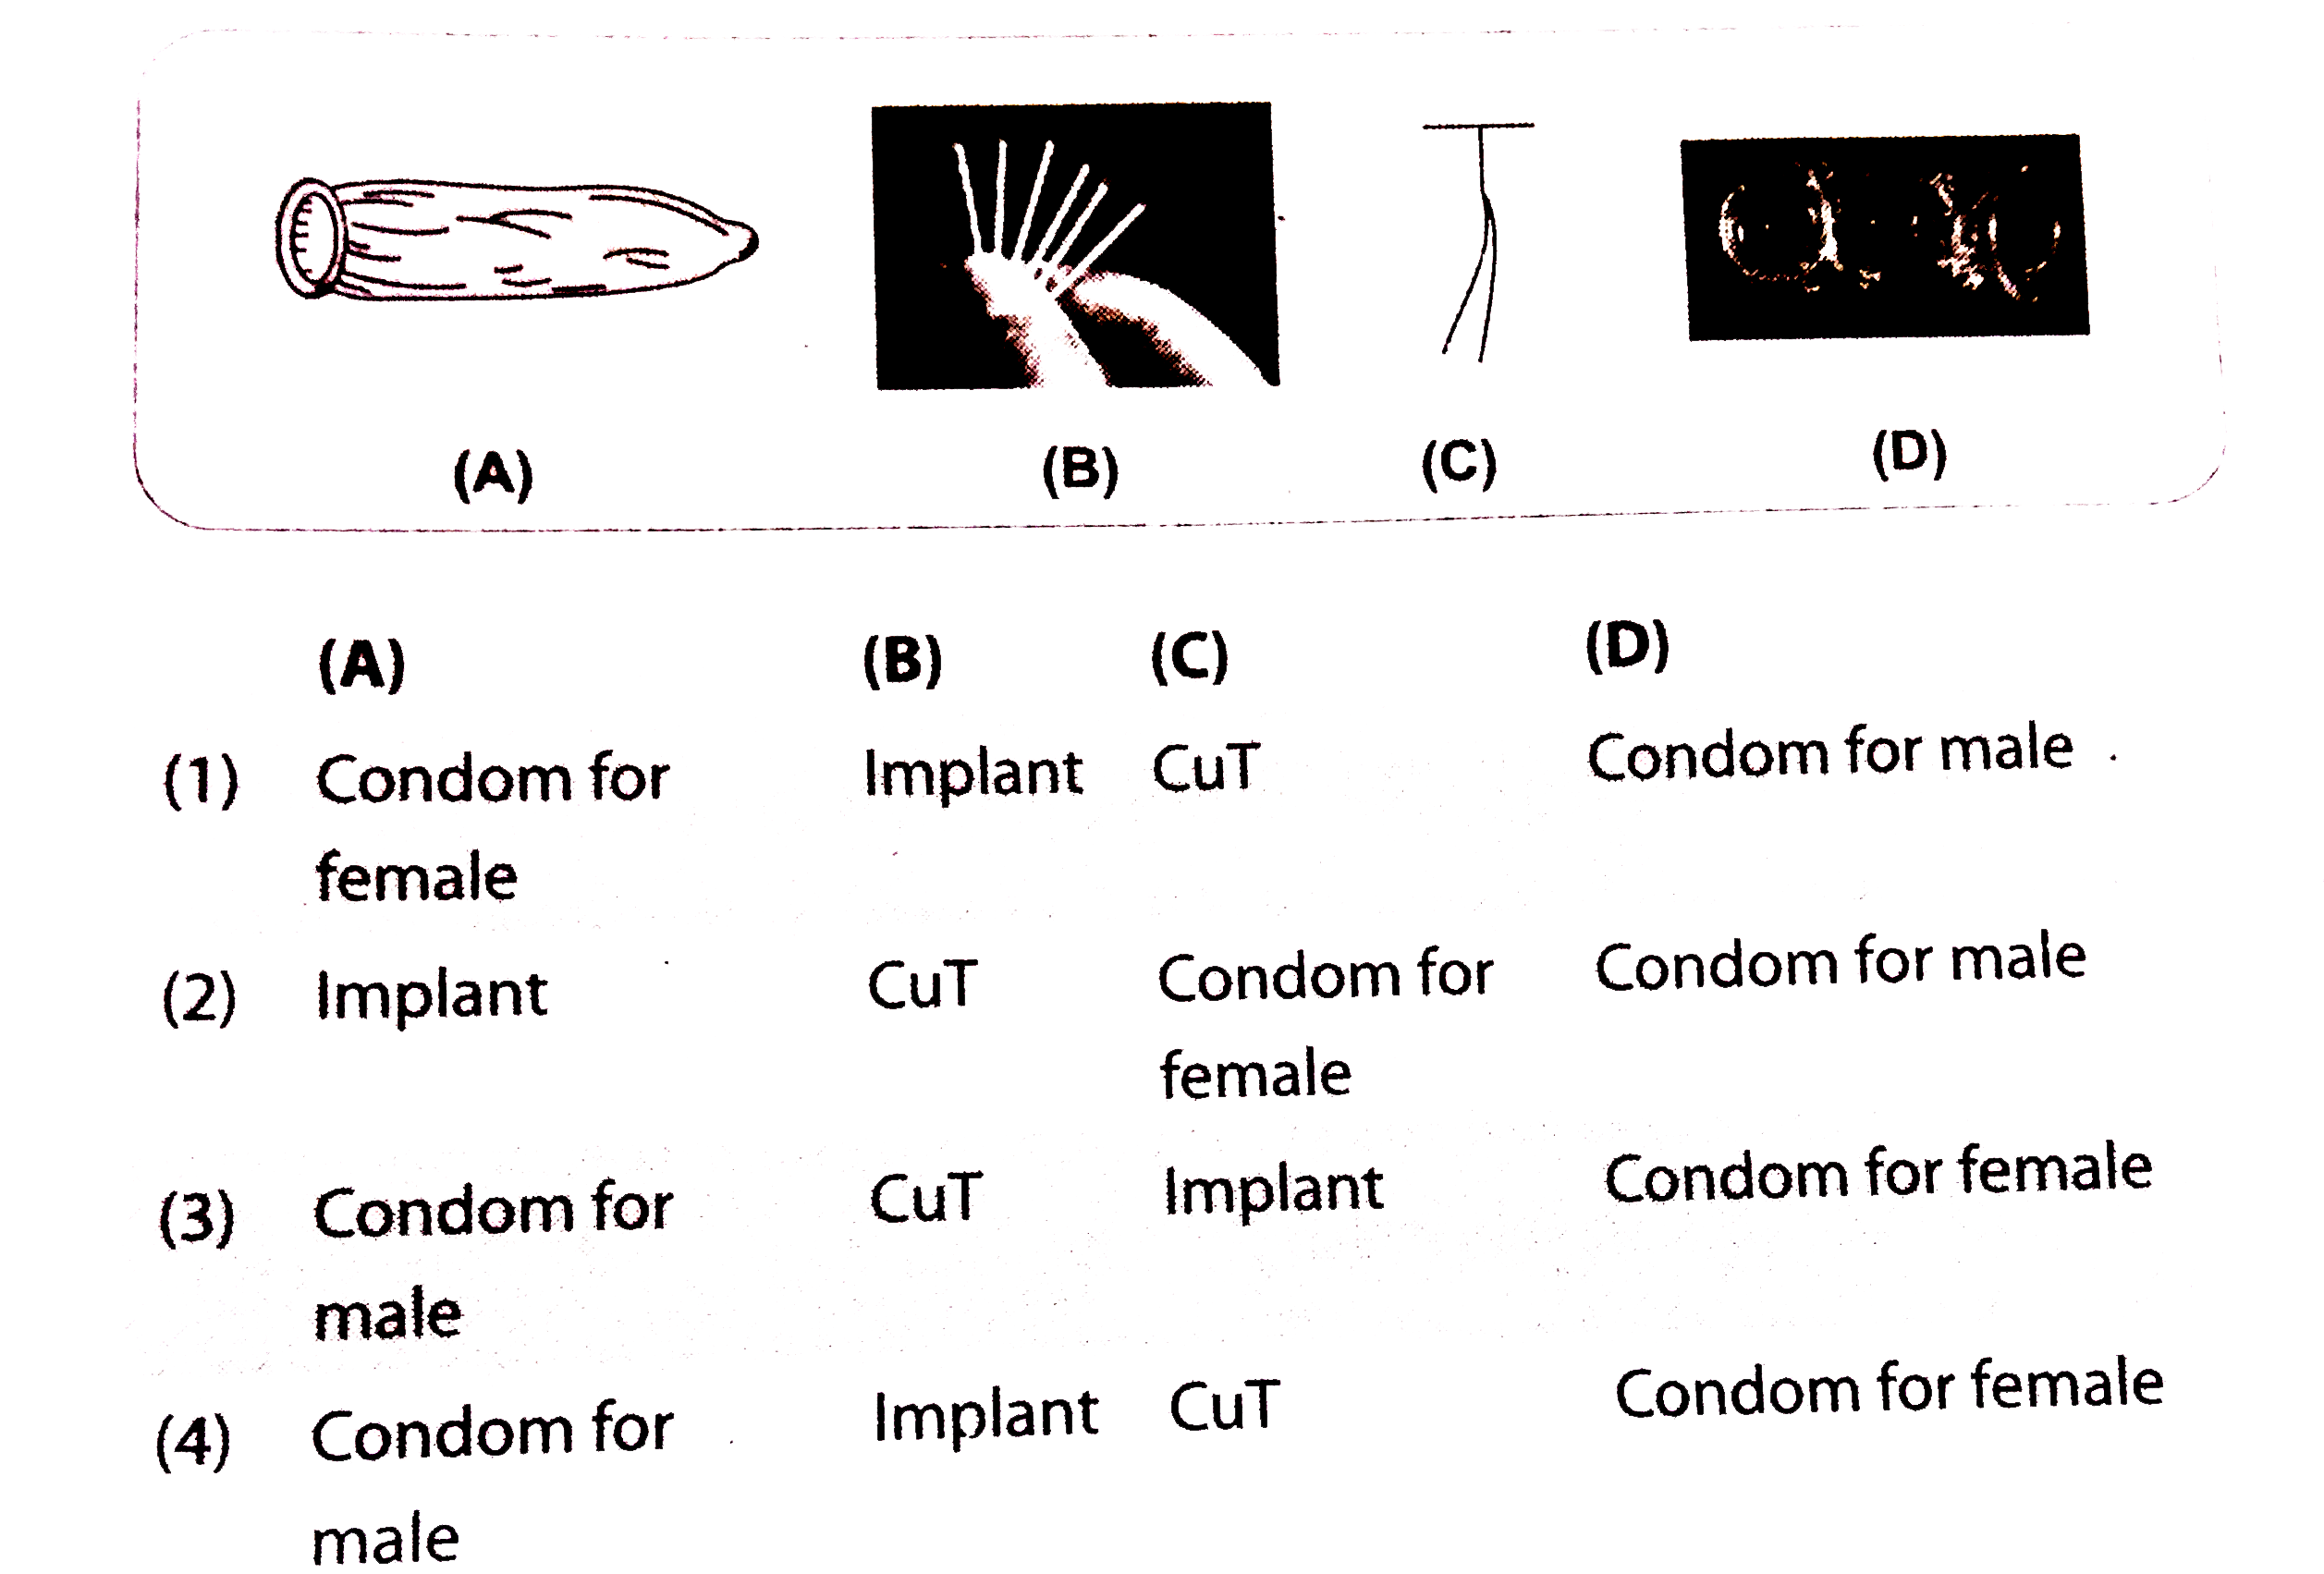
View Solution
