The current graph for resonance in LC circuit is
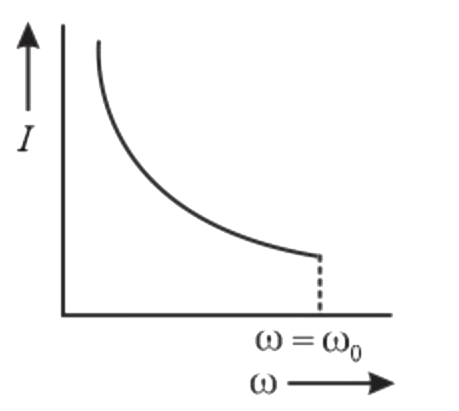
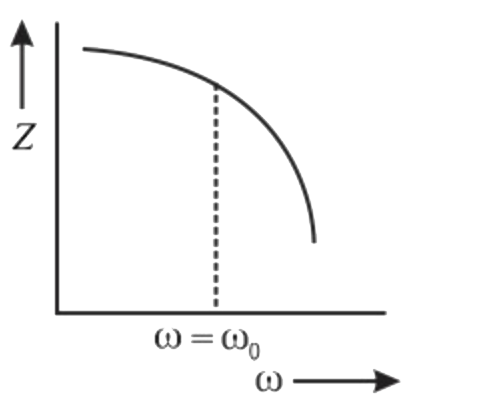
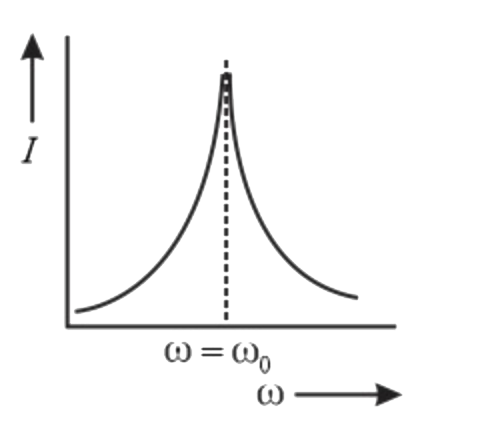
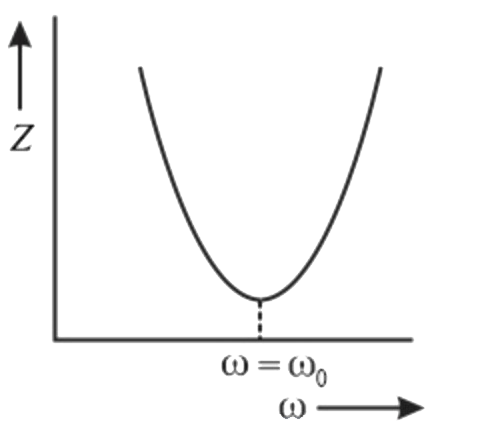
The correct Answer is:C
To solve the question regarding the current graph for resonance in an LC circuit, we can break down the solution into clear steps:
Step 1: Understand the LC Circuit
An LC circuit consists of an inductor (L) and a capacitor (C) connected together. The behavior of the circuit is characterized by its natural frequency, which is given by the formula:
ω0=1√LC
where ω0 is the angular frequency at which resonance occurs.
Step 2: Define Resonance Condition
At resonance, the inductive reactance (XL) equals the capacitive reactance (XC):
XL=XC
This leads to the condition where the impedance (Z) of the circuit becomes zero, allowing maximum current to flow through the circuit.
Step 3: Analyze Current Behavior
As the frequency of the applied AC signal approaches the natural frequency (ω0), the impedance of the circuit approaches zero. According to Ohm's Law:
I=EZ
where I is the current, E is the voltage, and Z is the impedance. When Z approaches zero, the current (I) approaches infinity:
I→∞asZ→0
Step 4: Graphical Representation
In a graph of current versus frequency, the current will show a peak at the natural frequency (ω0). This peak represents the resonance condition where the current is maximized. The graph typically resembles a sharp peak at the frequency corresponding to the natural frequency of the LC circuit.
Step 5: Identify the Correct Graph
Given the options, we need to identify the graph that shows a peak at the natural frequency. The correct graph will depict the current rising sharply as it approaches the natural frequency and then falling off as the frequency moves away from ω0.
Conclusion
The correct answer is the graph that shows the current peaking at the natural frequency of the LC circuit.
---
An LC circuit consists of an inductor (L) and a capacitor (C) connected together. The behavior of the circuit is characterized by its natural frequency, which is given by the formula:
ω0=1√LC
where ω0 is the angular frequency at which resonance occurs.
At resonance, the inductive reactance (XL) equals the capacitive reactance (XC):
XL=XC
This leads to the condition where the impedance (Z) of the circuit becomes zero, allowing maximum current to flow through the circuit.
As the frequency of the applied AC signal approaches the natural frequency (ω0), the impedance of the circuit approaches zero. According to Ohm's Law:
I=EZ
where I is the current, E is the voltage, and Z is the impedance. When Z approaches zero, the current (I) approaches infinity:
I→∞asZ→0
In a graph of current versus frequency, the current will show a peak at the natural frequency (ω0). This peak represents the resonance condition where the current is maximized. The graph typically resembles a sharp peak at the frequency corresponding to the natural frequency of the LC circuit.
Given the options, we need to identify the graph that shows a peak at the natural frequency. The correct graph will depict the current rising sharply as it approaches the natural frequency and then falling off as the frequency moves away from ω0.
The correct answer is the graph that shows the current peaking at the natural frequency of the LC circuit.
Similar Questions
Knowledge Check
At resonant frequency the current amplitude in series LCR circuit is
AmaximumBminimumCzeroDinfinity
Can we have resonance in LR or CR circuits?
View SolutionAssertion : At resonance, LCR series circuit have a minimum current.
Reason : At resonance, in LCR series circuit, the current and e.m.f. are not in phase with each other.
View SolutionThe value of current in two series LCR circuits at resonance is same, then
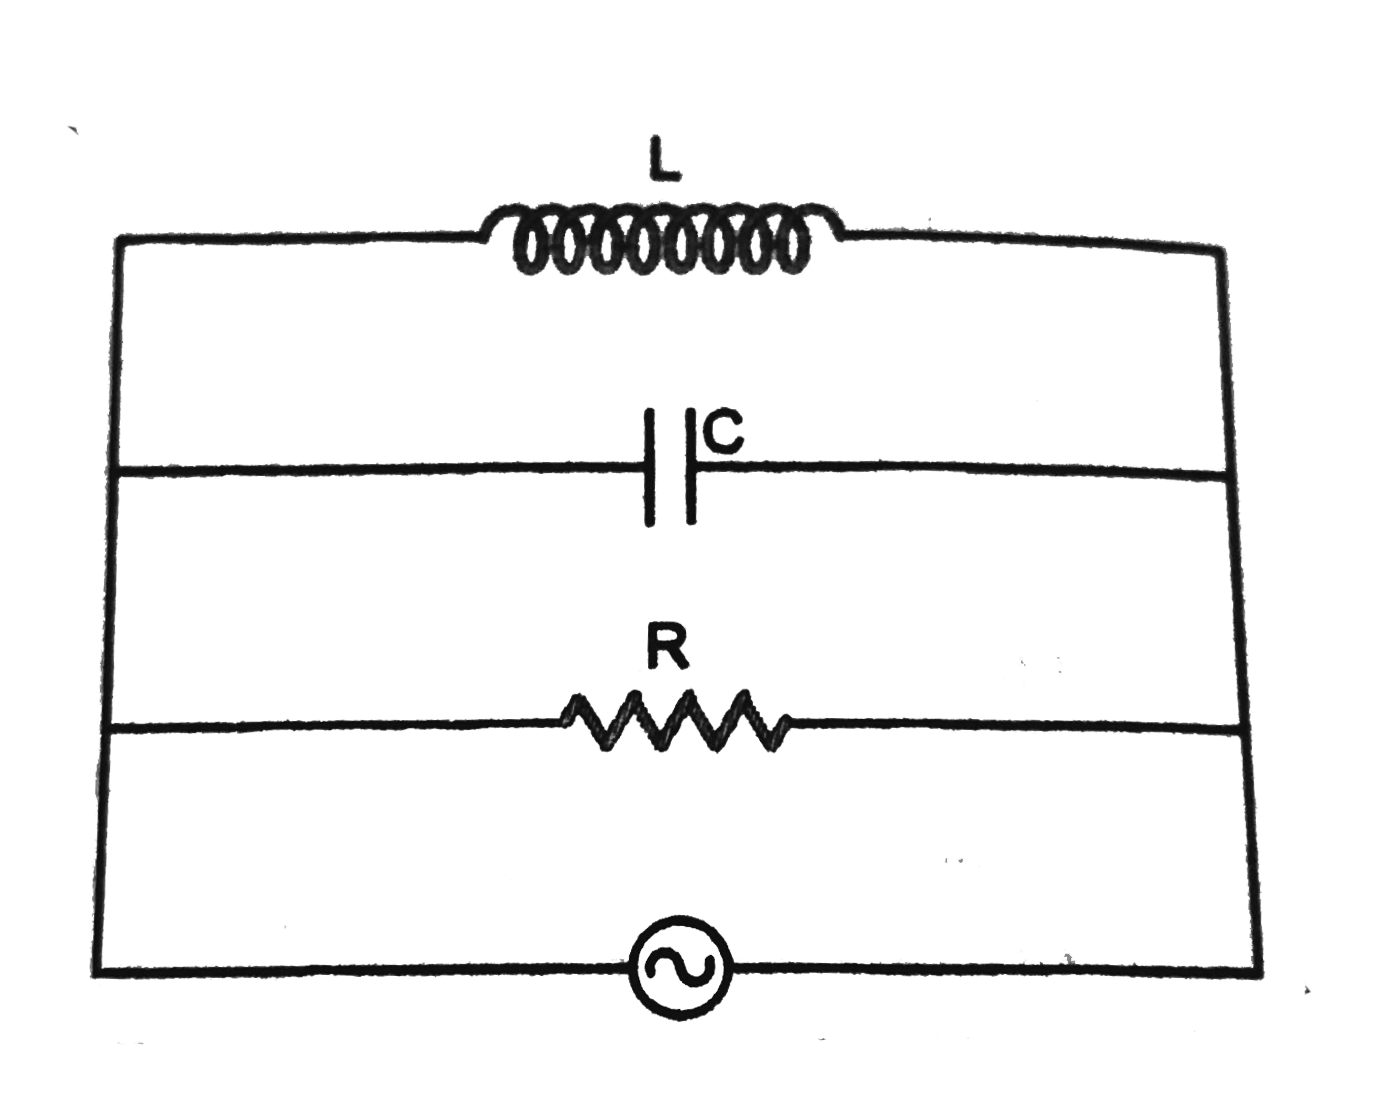
View SolutionKeeping the source of frequency equal to the resonating frequency of the series LCR circuit, if the three elements L, C and R in are arranged in parallel , show that the total current in the parallel LCR circuit is a minimum at this frequency. Obtain the r.m.s. value of current in each brach of the circuit for the elements and source specified in for this frequency.
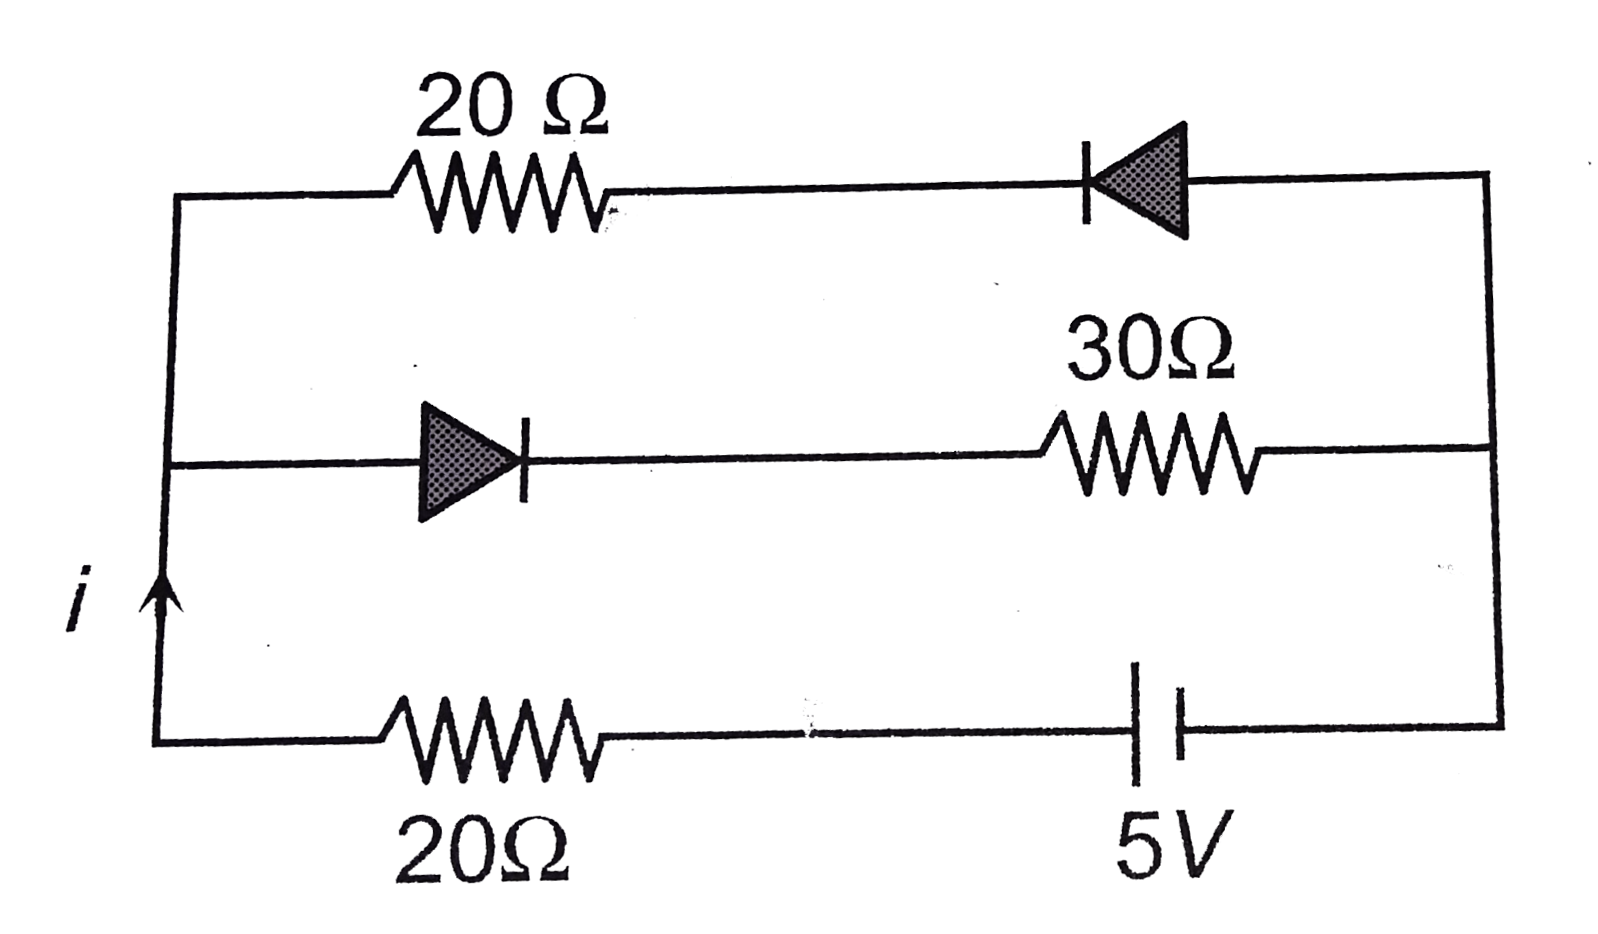
View SolutionCurrent in the circuit will be
View SolutionIllustrate the phenomena of resonance in series LCR A/C circuit with illustration.
View SolutionThe current in the circuit will be
View Solution

_PHY_E06_308_Q01.png)