Graph for specific heat at constant volume for a monoatomic gas
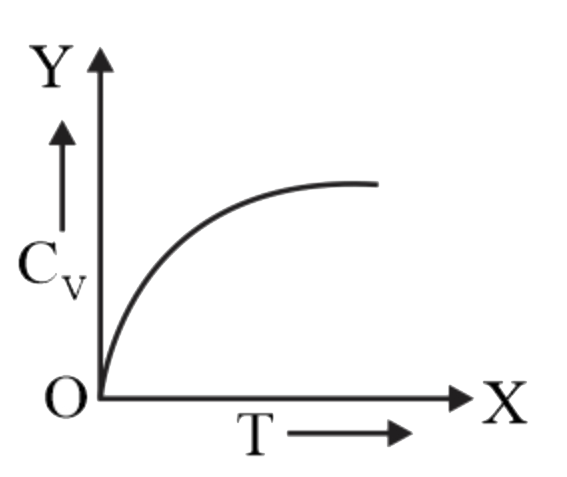
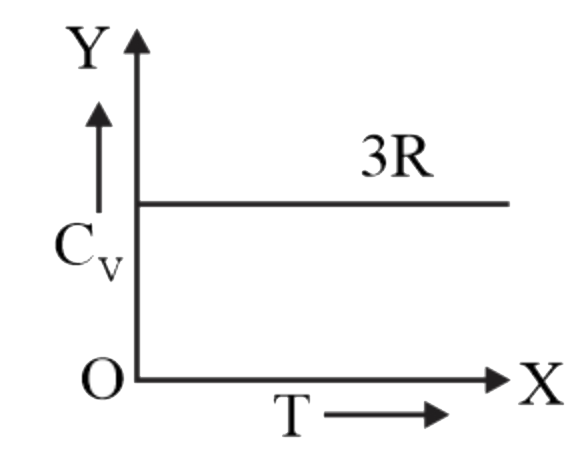
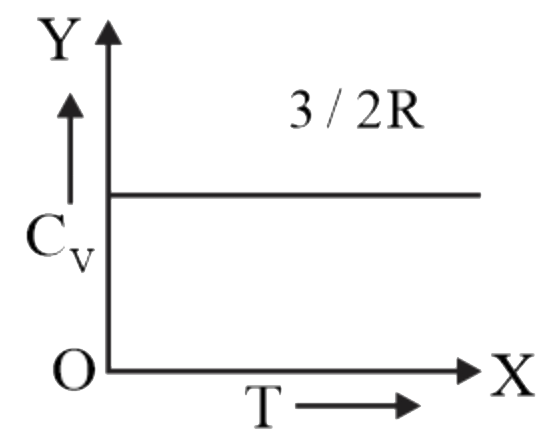
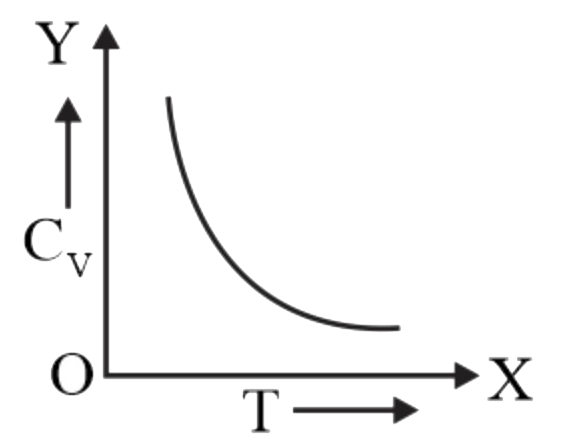
The correct Answer is:C
To solve the question regarding the graph for specific heat at constant volume (C_V) for a monoatomic gas, we can follow these steps:
Step 1: Understand the Formula
The specific heat at constant volume for a monoatomic gas is given by the formula:
CV=32R
where R is the universal gas constant.
Step 2: Analyze Independence from Temperature
From the formula, we can see that CV is a constant value for a monoatomic gas and does not depend on temperature. This means that regardless of the temperature changes, the specific heat at constant volume remains the same.
Step 3: Graph Representation
Since CV is constant, when we plot it against temperature (T), we will get a horizontal line. The y-axis will represent CV and the x-axis will represent temperature (T). The line will be at the value 32R.
Step 4: Identify the Correct Option
In the options provided, we need to identify which graph represents a constant value of CV as temperature changes. The correct graph will be a horizontal line at the height of 32R.
Conclusion
The graph for the specific heat at constant volume for a monoatomic gas is a horizontal line at the value of 32R, indicating that it is independent of temperature.
The specific heat at constant volume for a monoatomic gas is given by the formula:
CV=32R
where R is the universal gas constant.
From the formula, we can see that CV is a constant value for a monoatomic gas and does not depend on temperature. This means that regardless of the temperature changes, the specific heat at constant volume remains the same.
Since CV is constant, when we plot it against temperature (T), we will get a horizontal line. The y-axis will represent CV and the x-axis will represent temperature (T). The line will be at the value 32R.
In the options provided, we need to identify which graph represents a constant value of CV as temperature changes. The correct graph will be a horizontal line at the height of 32R.
The graph for the specific heat at constant volume for a monoatomic gas is a horizontal line at the value of 32R, indicating that it is independent of temperature.
Similar Questions
If the molar specific heat at constant pressure for a polyatomic non-linear gas is x and the molar specific heat at constant volume for a diatomic gas is y, find the value of x/y.
View SolutionThe molar specific heat at constant volume, for a non linear triatomic gas is
View SolutionCalculate the molar specific heat at constant volume of neon gas.
(R=8.314J mol−1K−1)
View SolutionOne mole of monoatomic gas and one mole of diatomic gas are mixed together. What is the molar specific heat at constant volume for the mixture ?
View SolutionThe molar specific heat at constant volume of gas mixture is 13R6. The gas mixture consists of
View SolutionThe heat capacity at constant volume of a monoatomic gas is 35j/K. Find
(a) the number of moles
(b) the internal energy at 0∘C.
(c ) the molar heat capacity at constant pressure.
View SolutionThe heat capacity at constant volume of a monoatomic gas is 35j/K. Find
(a) the number of moles
(b) the internal energy at 0∘C.
(c ) the molar heat capacity at constant pressure.
View SolutionA process in which work perfomed by an ideal gas is proportional to the corresponding increment of its internal energy is described as a polytropic process. If we represent work done by a ppolytropic process by W and increase in internal energy as ΔU then
W∝ΔU
or W=K1ΔU ...(i)
For this process, it can be demonstrated that the relation between pressure and volume is given by the equation
PVη=K2 (constant ) .....(ii)
We know that a gas can have various values for molar specific heats. The molar specific heat 'C' for an ideal gas in polytropic process can be calculated with the help of first law of thermodynamics. In polytropic process process the variation of molar specific heat 'C' with η for a monatomic gas is plotted as in the graph shown.
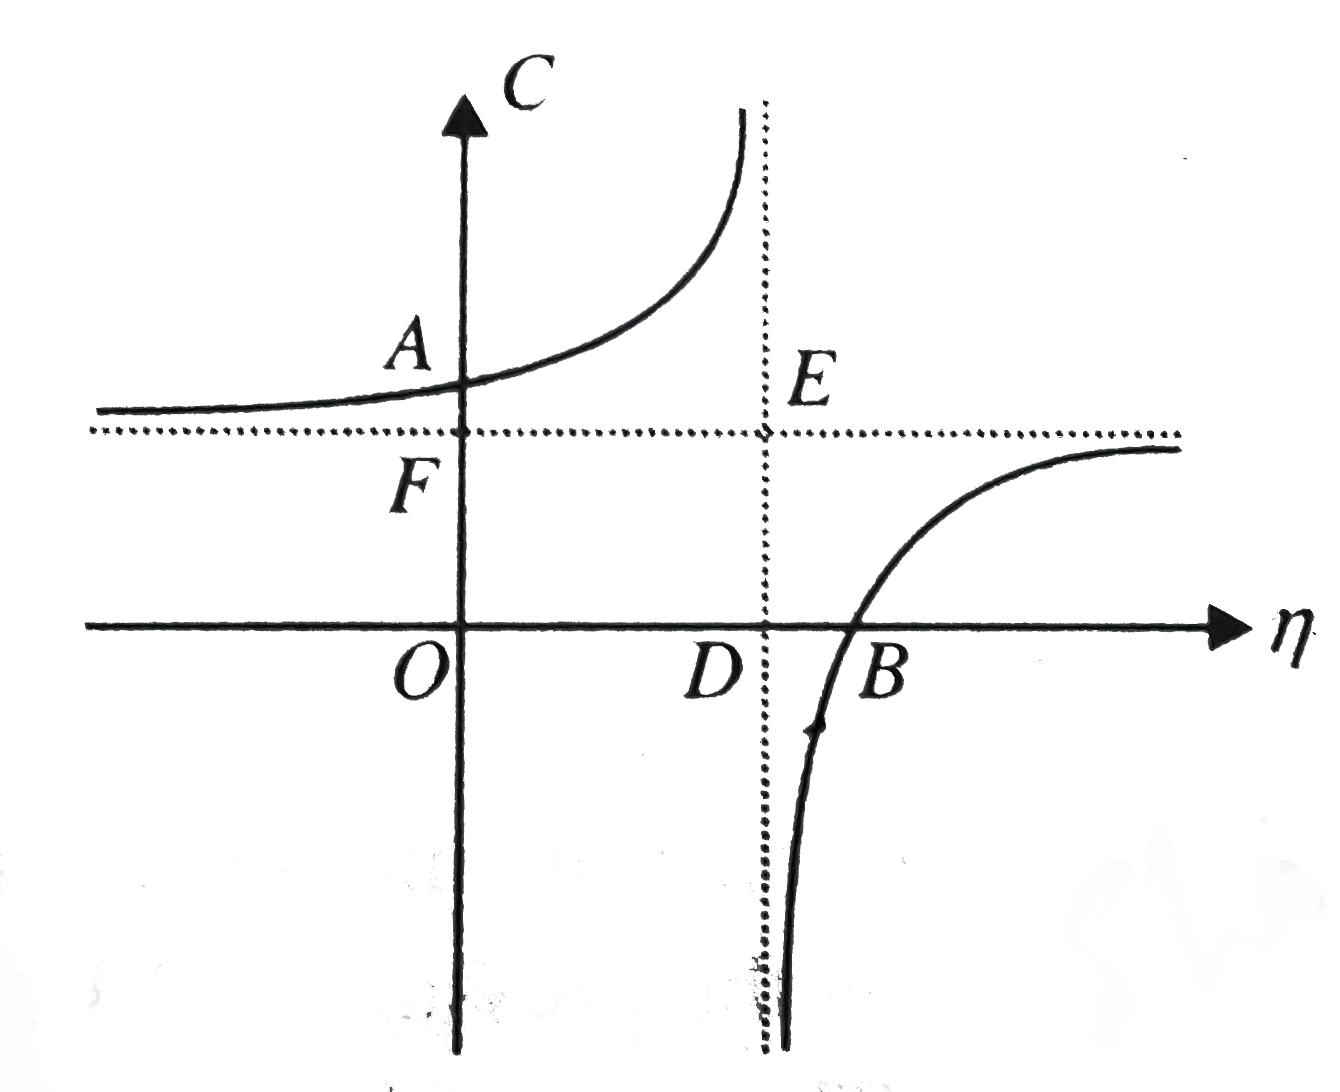
For a monoatomic gas, the values of polytropic constant η for which value specific heat is negative.
View SolutionFind the molar specific heat of the process p=aT for a monoatomic gas, a being constant.
View SolutionSupposing the distance between the atoms of a diatomic gas to be constant, its specific heat at constant volume per mole (gram mole) is
View Solution
