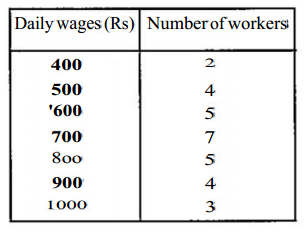
The table below shows the workers in a factory sorted according to their daily wages :Calculate the median daily wage.
 .Solution in Malayalam
Step by step video & image solution for The table below shows the workers in a factory sorted according to their daily wages :Calculate the median daily wage. . by Maths experts to help you in doubts & scoring excellent marks in Class 10 exams.
Updated on:21/07/2023Similar Questions
The area of the shaded part in the figure given below is ______.

View SolutionThe inequation represented by the graph given below is :
View SolutionThe inequation that best describes the graph given below is _________
View SolutionThe inequation that best describes the following graph is _________
View SolutionThe following table gives the daily wages of workers in a factory . Compute the standard deviation and the co - effcient of the wages of the workers
(##VIK_MAT_IIA_QB_C08_SLV_014_Q01.png" width="80%">
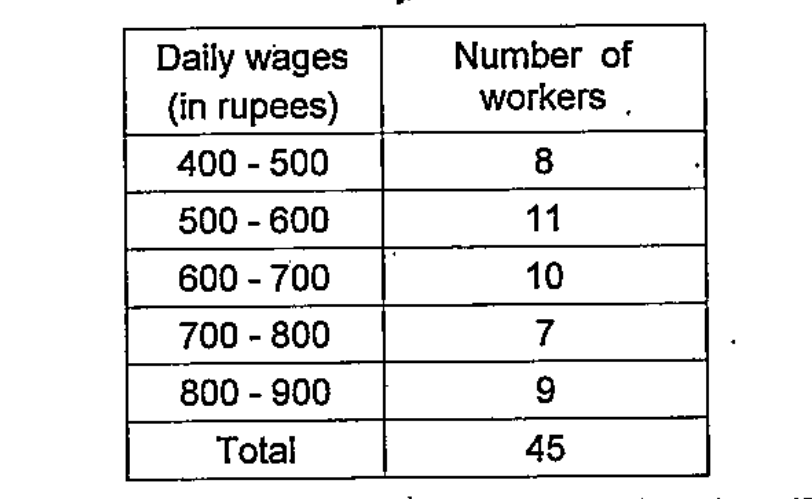
View SolutionThe following table shows the details of daily wages of 45 workers in a factory.
Calculate the median daily wage.
 .
.
View SolutionThe daily wages (in ) of 100 labourers in a factory are gien below :
Daily wages (in ₹)360280420320400300380Number of labourers171018271684
Find the median wages.
View Solution
