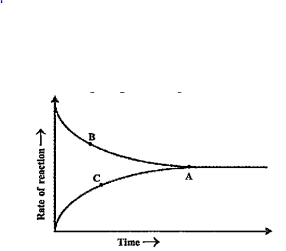
The graph showing the progress of the reaction N2+3H2↔2NH3, is given

Is there any change in the concentration, as time passes after attaining the stage A? Explain. Solution in Malayalam
Step by step video & image solution for The graph showing the progress of the reaction N_2+3H_2harr2NH_3, is given Is there any change in the concentration, as time passes after attaining the stage A? Explain. by Chemistry experts to help you in doubts & scoring excellent marks in Class 10 exams.
Topper's Solved these Questions
- BOOK - BODY BOOKS PUBLICATIONCHAPTER - COMPOUNDS OF NON-METALSEXERCISE - EXERCIES7videos
COMPOUNDS OF NON-METALS
- BOOK - BODY BOOKS PUBLICATIONCHAPTER - CHEMICAL REACTIONS OF ORGANIC COMPOUNDS EXERCISE - EXERCISE20videos
CHEMICAL REACTIONS OF ORGANIC COMPOUNDS
- BOOK - BODY BOOKS PUBLICATIONCHAPTER - GAS LAWS AND MOLE CONCEPTEXERCISE - EXERCISE6videos
GAS LAWS AND MOLE CONCEPT
Similar Questions
Fill in the blanks: Liquor ammonia: concentrated aquous solution of ammonia; Liquid ammonia:………………….
05:07View SolutionFill in the blanks: Methanol-Wood Spirit ::Ethanol-................
03:08View SolutionIdentify the relation and complete: Atomic Mass of 1g carbon-12 g. Atomic Mass of 1g Oxygen………………….
View Solutionअभिक्रिया N2+3H2⇔2NH3 को स्थिर दाब एवं ताप पर कराया जाता है यदि ΔH तथा ΔU क्रमशः एंथल्पी में परिवर्तन तथा आंतरिक ऊर्जा में परिवर्तन हो, तो :
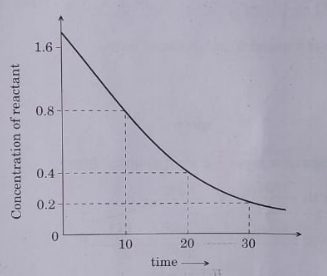
04:18View SolutionAnalyse the given graph,drawn between concentration of reactant vs. time.
(a)Predict the order of reaction.
(b)Theoretically, can the concentration of the reactant reduce to zero after infinite time?Explain. 08:29View Solution
For the reaction N2+3H2→2NH3 the rate of change of concentration for hydrogen is −0.3×10⁻⁴Ms−1. The rate of change of concentration of ammonia is
03:24View SolutionWhat will be the nature of the graph showing the concentration of the reactant and time of a first order reaction ?
02:15View SolutionPlot a graph of concentration of a reactant at time t, [ (a-x)] against time for a first order reaction .Here a = initial concentration of the reactant an x = change in concentration of the reactant at any time 1 during the reaction.
02:15View SolutionThe following graph X to For the Y reaction, the concentration of X and Y changes over time, showing the point of intersection of both curves -
02:43View SolutionA graph, ploted between concentration of reactant consumed at any time (x) and time t is found to be a straight line passing through the origin. Thus reaction is of:
02:07View SolutionA graph, ploted between concentration of reactant consumed at any time (x) and time t is found to be a straight line passing through the origin. Thus reaction is of:
01:41View SolutionN_2+3H_2harr2NH_3 The equivalent constant of this chemical reaction is 'K'. Then 2N_2+6H_2harr4NH_3 This reaction will be constant
02:54View SolutionA reaction follows the given concentration-time graph The rate for this reaction at 20 s will be
 02:29View Solution
Draw a Schematic graph showing how the rate of reaction changes with change in concentration of reactant for zero order reaction.
07:06View SolutionThegraph showing the progress ofthe re-action N_2+3H_2harr2NH_3 , is given : Identify the reactions represented by B and C?
02:01View Solution

