Consider the function
f(x)=|x|+1,g(x)=1−|x|
sketch the graph and shade the enclosed region between themSolution in Malayalam
Step by step video & image solution for Consider the function f(x)=abs(x)+1,g(x)=1-abs(x) sketch the graph and shade the enclosed region between them by Maths experts to help you in doubts & scoring excellent marks in Class 12 exams.
Updated on:21/07/2023Topper's Solved these Questions
Similar Questions
The radius of a balloon is increasing at the rate of 10cm/sec. At what rate is the surface area of the balloon increasing when the radius is 15 cm.
View SolutionConsider the function f(x)={sin2axx2x≠01x=0 Redefine the function in such a way that it becomes continuous at x=0.
View SolutionIf functions f: R -gt R and g : R -gt R arc given by f(x) = abs(x) and g(x) =abs(x) , (where abs(A) is indicatescates: integer function) find f o g(abs(-1/2)) and go f(-1/2) .
View Solutionf(x)=|x|+|x−1| find f'(1+):
View SolutionConsider the fractions:
f(x)=|x|−1andg(x)=1−|x|.
(a) Find their graphs and shade the closed region between them
(b) Find the area of their shaded region.
View SolutionConsider the functions, f(x)=|x|−1 and g(x)=1−|x| (a) Sketch their graphs and shade the closed region between them. (b) Find the area of their shaded region.
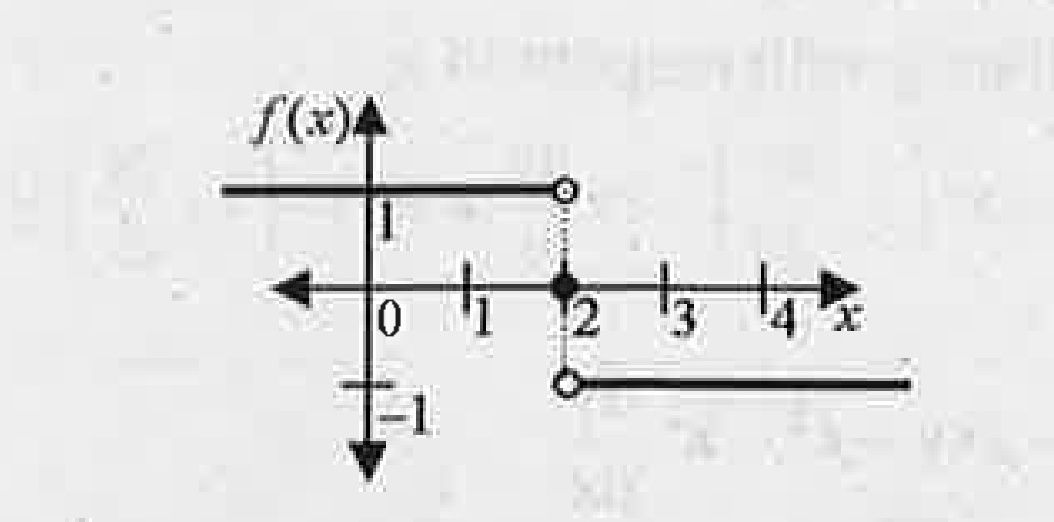
View SolutionConsider the figure and answer the question.
Identify the graphed function.
f(x)=|x−1|x−1

View SolutionConsider the function f(x)=|x|+|x+1|
define trhe function f(x) in the interval
[-2,1]
View SolutionConsider the function
f(x)=|x|−1,g(x)=1−|x|
sketch the graph and shade the enclosed region between them
View SolutionConsider the function
f(x)=|x|−1,g(x)=1−|x|
Find the area of the shaded region
View SolutionDraw the graph of the function
f(x)=|x|+1,x∈R
View SolutionSketch the graph of the function
f(x)=|x+1|
View SolutionConsider the function f(x)=|x|—3
draw the graph of f(x)
View SolutionSketch the graphs of the following functions.
f(x) = 1+1x2
View SolutionSketch the graphs of the following functions.
f(x) = (x−1)2
View SolutionWithout using graph paper the graph of the function y=f(x)=|x−1|+|x+1| for −2≤x≤2 and examine whether the function has any point of discontinuty.
View Solution
