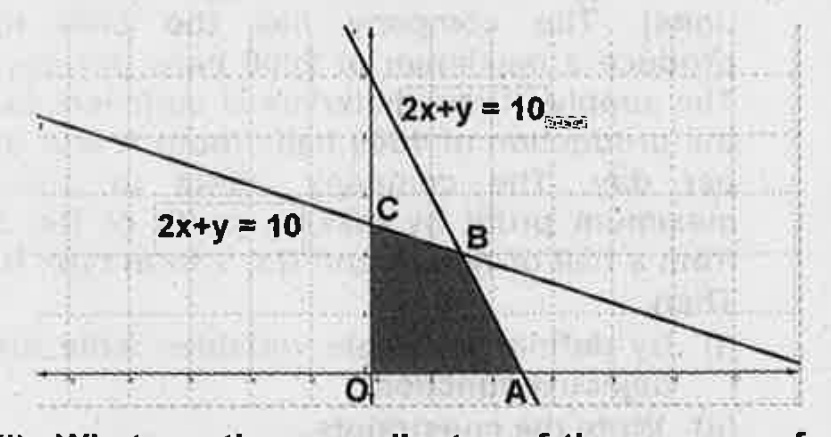
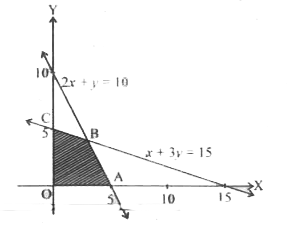
The graph of linear programming problem is given below.The shaded region is the feasible region.The objective function is Maximise, Z=px+qy
If the Max,Z occurs at A and B,what is the relation between pand q?
 Solution in Malayalam
Step by step video & image solution for The graph of linear programming problem is given below.The shaded region is the feasible region.The objective function is Maximise, Z =px+qy If the Max,Z occurs at A and B,what is the relation between pand q? by Maths experts to help you in doubts & scoring excellent marks in Class 12 exams.
Updated on:21/07/2023Topper's Solved these Questions
- LINEAR PROGRAMMINGBOOK - BODY BOOKS PUBLICATIONCHAPTER - LINEAR PROGRAMMINGEXERCISE - EXERCISE
2 Videos
- INVERSE TRIGONOMETRIC FUNCTIONSBOOK - BODY BOOKS PUBLICATIONCHAPTER - INVERSE TRIGONOMETRIC FUNCTIONSEXERCISE - EXERCISE
97 Videos
- MATRICESBOOK - BODY BOOKS PUBLICATIONCHAPTER - MATRICESEXERCISE - EXERCISE
107 Videos
Similar Questions
Consider the LPP
Maximise z=3x+2y
Subject to the constraints
x+2y≤10,3x+y≤15,x,y≥0
Find the maximum value of Z.
View SolutionProve that
tan−1(12)+tan−1(211)=tan−1(34)
View SolutionFind the inverse of the matrix A=[2174] using column transformation.
View SolutionDetermine the point of symmetry of a regular hexagon.
View SolutionDtermine the images of the following figure about the given line :
View SolutionFind the area of the shaded region, given that the radius of each circle is equal to 5 cm.
View SolutionMatch the following Column A to Column B

View SolutionMatch the following Column A to Column B

View SolutionMatch the following Column A to Column B

View SolutionThe area of the shaded part in the figure given below is ______.

View SolutionThe inequation represented by the graph given below is :
View SolutionThe inequation that best describes the graph given below is _________
View SolutionThe inequation that best describes the following graph is _________
View SolutionWhich inequations represent the shaded region in the given figure
View SolutionMatch the items given in column A and B: ltimg src="https://d10lpgp6xz60nq.cloudfront.net/physics_images/NCERT_BIO_XII_C16_E01_004_Q01.png" width="80%"gt
View SolutionThe graph of a linear programming problem is given below. The shaded region is the feasible region. The objective function is Max Z=px+qy

(i) What are the coordinates of the corners of the feasible region.
(ii) Write the constraints.
(iii) If the Z occurs at A and B, what is the relation between p and q.
(iv) If q=1 write the objective, function.
(v) Find the Max Z.
View Solution
